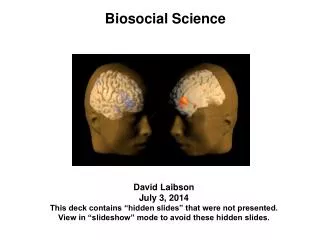
Biosocial Science
Biosocial Science. David Laibson July 3, 2014 This deck contains “hidden slides” that were not presented. View in “slideshow” mode to avoid these hidden slides. Outline:. Biosocial science: definition and methods Multiple Systems Hypothesis Genoeconomics. Biosocial science: definition.

Biosocial Science
E N D
Presentation Transcript
Biosocial Science David LaibsonJuly 3, 2014This deck contains “hidden slides” that were not presented. View in “slideshow” mode to avoid these hidden slides.
Outline: • Biosocial science: definition and methods • Multiple Systems Hypothesis • Genoeconomics
Biosocial science: definition. Definition: Biosocial science is the study of the biological microfoundations of economic cognition and economic behavior. • Biological microfoundations are neurochemical mechanisms and pathways, like brain systems, neurons, genes, and neurotransmitters. • Economic cognition is cognitive activity that is associated with economic perceptions, beliefs and decisions, including mental representations, emotions, expectations, learning, memory, preferences, and decision-making.
fMRI: functional magnetic resonance imaging Source: Scott Huettel
The fMRI Blood-Oxygenation-Level-Dependent (BOLD) ResponseIncreased neuronal activity results in increased MR (T2*) signal BASELINE ACTIVE Source: Scott Huettel
Basic experimental design Time Task A Task B Task C Rest 12 sec Rest 12 sec Rest 12 sec Rest 12 sec
Basic econometric methodology • Divide brain into 30,000 voxels (cubes 2 mm on edge) • Measure blood flow at the voxel level (BOLD signal) • Run “regressions” (general linear model) relating BOLD signal to covariates: BOLDv,i,t = FEi + controlst + task dummyt • Indexes for voxel (v), subject (i), and time (t) • Controls: time in scanner, lagged reward event, etc. • event dummy: decision, experience, event, etc. • Analogous method: “contrast”
Multiple-testing problem (cfVul et al 2010) Don’t worry: • Strict thresholds (α = 0.001 and 5-voxel contiguity) • Pre-specification of hypothesis (ROI) • Replication • Converging lines of evidence (fMRI, single neuron measurement, knock-outs, legions, rTMS) • This is the same multiple testing problem that hangs over all empirical research Worry: • Are all significant voxels reported? • Were the specification searches reported? • Are all GLM’s (regressions) reported? • Is the neuroscientific explanation of the data post-hoc? • Shouldn’t the effect size be adjusted for multiple testing
Part I: A neuroeconomics example:The Multiple Systems Hypothesis • Statement of Hypothesis • Variations on a theme • Caveats • Illustrative predictions • Cognitive load manipulations • Willpower manipulations • Affect vs. analytic manipulations • Cognitive Function • Development • Neuroimaging/TMS • Directions for future research
Statement of Multiple Systems Hypothesis (MSH) • The brain makes decisions (e.g. constructs value) by integrating signals from multiple systems • These multiple systems process information in qualitatively different ways and in some cases differentially weight attributes of rewards (e.g., time delay)
An (oversimplified) multiple systems model System 2 System 1 Integration Behavior
An uninteresting example What is 6 divided by 3? Division Addition Integration Behavior
A more interesting example Would you like a piece of chocolate? Visceral reward: pleasure Abstract goal: diet Integration Behavior
A more interesting example Would you like a piece of chocolate? Visceral reward: pleasure Abstract goal: diet Integration Behavior
Variations on a theme • Charioteer’s two horses (Socrates/Plato, The Phaedrus, 370 BC):“First the charioteer of the human soul drives a pair, and secondly one of the horses is noble and of noble breed, but the other quite the opposite in breed and character. Therefore in our case the driving is necessarily difficult and troublesome.” • Interests vs passions (Smith) • Superego vs Ego vs Id (Freud) • Controlled vs Automatic (Schneider & Shiffrin, 1977; Benhabib & Bisin, 2004) • Cold vs Hot (Metcalfe and Mischel, 1979) • System 2 vs System 1 (Frederick and Kahneman, 2002) • Deliberative vs Impulsive (Frederick, 2002) • Conscious vs Unconscious (Damasio, Bem) • Effortful vs Effortless (Baumeister) • Planner vs Doer (Shefrin and Thaler, 1981) • Patient vs Myopic (Fudenburg and Levine, 2006) • Abstract vs Visceral (Loewenstein & O’Donoghue 2006; Bernheim & Rangel, 2003) • PFC & parietal cortex vs dopamine reward system (McClure et al, 2004)
Affectivevs. AnalyticCognition Frontal cortex Parietal cortex mPFC mOFC vmPFC Dopamine reward system
Relationship to quasi-hyperbolic model • Hypothesize that the fronto-parietal system (PFC) is patient • Hypothesize that dopamine reward system (DRS) is impatient. • Then integrated preferences are quasi-hyperbolic
Relationship to quasi-hyperbolic model • Hypothesize that dopamine reward system is impatient. • Hypothesize that the fronto-parietal system is patient • Here’s one implementation of this idea: Ut = ut + b [dut+1 + d2ut+2 + d3ut+3 + ...] (1/b)Ut = (1/b)ut + dut+1 + d2ut+2 + d3ut+3 + ... (1/b)Ut =(1/b-1)ut+ [d0ut + d1ut+1+ d2ut+2 + d3ut+3 + ...] DRSfronto-parietal cortex
Affective system fast unconscious reflexive myopic Analytic system Effortful slow conscious reflective forward-looking (but still prone to error: heuristics may be analytic) Commonalities between classification schemes
Caveats • N ≥ 2 • The systems do not have well-defined boundaries (they are densely interconnected) • Maybe we should not say “system,” but should instead say “multiple processes” • Some systems may not have a value/utility representation • Making my diet salient is not the same as assigning utils/value to a Devil Dog • If you look downstream enough, you’ll find what looks like an integrated system (see many papers by Antonio Rangel)
Related Predictions • Cognitive Load Manipulations • Shiv and Fedorikhin (1999), Hinson, Jameson, and Whitney (2003) • Willpower manipulations • Baumeister and Vohs (2003) • Affect vs. analytic manipulations • Rodriguez, Mischel and Shoda (1989) • Cognitive Function • Benjamin, Brown, and Shapiro (2006), Shamosh and Gray (2008) • Developmental Dynamics • Green, Fry, and Myerson (1994), • Neuroimaging/TMS Studies • Tanaka et al (2004), McClure et al (2004), Hariri et al (2006), McClure et al (2007), Kabel and Glimcher (2007), Hare, Camerer, and Rangel (2009), Figner et al (2010), Albrecht et al (2010)
Neural activity in fronto-parietal regions differentiated from neural activity in dopamine reward system regions • Not clear. • At least seven relevant studies: • McClure et al (2004) – supportive • McClure et al (2007) – supportive • Kable and Glimcher (2007) – critical • Hariri et al (2007) – supportive • Hare, Camerer, and Rangel (2009) – integration • Fehr et al (2009) – supportive • Albrecht et al (2010) – supportive • And one other study that is related (and supportive): • Tanaka et al (2004): different behavioral task
McClure, Laibson, Loewenstein, Cohen (2004) • Intertemporal choice with time-dated Amazon gift certificates. • Subjects make binary choices: $20 now or $30 in two weeks $20 in two weeks or $30 in four weeks $20 in four weeks or $30 in six weeks
Dopamine reward system Fronto-parietal cortex $20 $30 Fronto-parietal cortex $20 $30 Fronto-parietal cortex $20 $30
x = -4mm PCC VStr MOFC MPFC y = 8mm z = -4mm Delay to earliest reward = Today Delay to earliest reward = 2 weeks Delay to earliest reward = 1 month • areas respond “only” to immediate rewards 7 T1 0 BOLD Signal Time 0.2% 2 sec
0.4% 2s Delay to earliest reward = Today Delay to earliest reward = 2 weeks Delay to earliest reward = 1 month d Areas respond equally to all rewards VCtx PMA RPar x = 44mm DLPFC VLPFC LOFC x = 0mm 15 0 T1
Brain activity in the frontoparietal system and dopamine reward system predict behavior(Data for choices with an immediate option.) Fronto-parietal cortex 0.05 Brain Activity 0.0 DRS -0.05 Choose Immediate Reward Choose Delayed Reward
Subjects water deprived for 3hr prior to experiment (a subject scheduled for 6:00) McClure, Ericson, Laibson, Loewenstein, Cohen (2007)
A 15s 10s 5s Time … i ii iii iv. Juice/Water squirt (1s ) B (i) Decision Period (ii) Choice Made (iii) Pause (iv) Reward Delivery Free (10s max.) 2s Free (1.5s Max) Variable Duration 15s Figure 1
d = This minute d'-d = 5 minutes(R, R') = (2,3) Experiment Design d d'-d (R, R') { This minute, 10 minutes, 20 minutes } { 1 minute, 5 minutes } {(1,2), (1,3), (2,3)}
areas (p<0.001): respond to all rewards x = 0mm x = -48mm areas (p<0.001): respond to immediate rewards Juice only Amazon only Both x = 0mm y = 8mm Relationship to Amazon experiment: Figure 5
+ + + Rate Taste Hare, Camerer, and Rangel (2009) Health Session Taste Session Decision Session 4s food item presentation Rate Health Rate Taste Decide fixation Rate Health Decide
Details • Taste and health ratings made on five point scale: -2,-1,0,1,2 • Decisions also reported on a five point scale: SN,N,0,Y,SY “strong no” to “strong yes” • Subject choices sometimes reflect self control • Rejection of an unhealthy, good tasting food, OR • Consumption of a healthy, bad tasting food
More activity in DLPFC in successful self control trials than in failed self control trials L • p < .001 • p < .005
Figner, Knoch, Johnson, Krosch, Lisanby, Fehr and Weber (2010) • Disruption of function of left, but not right, lateral prefrontal cortex (LPFC) with low-frequency repetitive transcranial magnetic stimulation (rTMS) increased choices of immediate rewards over larger delayed rewards. • rTMS did not change choices involving only delayed rewards or valuation judgments of immediate and delayed rewards. • Causal evidence for a neural lateral-prefrontal cortex–based self-control mechanism in intertemporal choice.
Albrecht, Volz, Sutter, Laibson, and von Cramon (2011) • An immediate reward in a choice set elevates activation of the ventral striatum, pregenual anterior cingulate cortex and anterior medial prefrontal cortex. • These dopaminergic reward areas are also responsive to the identity of the recipient of the reward. • Even an immediate reward does not activate these dopaminergic regions when the decision is being made for another person. • Results imply that participants show less affective engagement (i) when they are making choices for themselves that only involve options in the future or (ii) when they are making choices for someone else. • Also find that behavioral choices reflect more patience when choosing for someone else.
Part II: Genoeconomics David Laibson Economics Department, Harvard University October 20, 2013
Main Collaborators • Dan Benjamin (Cornell University)* • David Cesarini (New York University)* • Christopher F. Chabris (Union College) • Jaime Derringer (University of Colorado-Boulder) • Magnus Johanesson (Stockholm School of Economics) • Philipp Koellinger (Rotterdam University)* • Sarah Medland (Queensland Inst. of Medical Research) • NielsRietveld (Rotterdam University) • Olga Rostapshova (Harvard University) • Patrick Turley (Harvard University) • Peter Visscher (University of Queensland) • *co-leaders of the Social Science Genetic Association Consortium • We gratefully acknowledge NIH’s NIA and OBSSR, NSF, and the RagnarSöderberg Foundation for financial support.
Background In the last 20 years, there have been rapid, advances in measuring genetic variation across individuals. The cost of genotyping continues to decline precipitously (now about $100 per person) Many large-scale social surveys now collect genetic data on respondents We are at the beginning of an explosion in social-science genetics research
Genoeconomics Outline Some promises for social science Conceptual framework Discovering genetic effects The power problem Some ways forward Public policy questions
Genetic data in Social Science • Biological mechanisms for behavior • Direct measures of structural parameters • E.g., preferences, abilities • Instrumental variables (Turley et al 2013) • Control variables • Prediction • Targeting interventions • E.g., children susceptible to dyslexia.
Outline Some promises for social science Conceptual framework Discovering genetic effects The power problem Some ways forward Public policy questions
Genetics Primer Human DNA is a sequence of ~3 billion nucleotide molecules (spread across 23 chromosomes). This human genome has 20,000-25,000 subsequences called genes. Genes provide instructions for building proteins. At the vast majority of locations on the genome, there is no “common” variation in nucleotides across individuals.
SNPs: single-nucleotide polymorphisms (a single DNA base pairthat differs with meaningful frequency across people) • About 1-5 million loci • Genotyping: mapping some part of a person’s DNA (e.g., 2 million SNPs, using an Illumina chip)
Single-nucleotide polymorphisms (SNPs): Nucleotides where individuals differ (a small % of all nucleotides). (There are also other types of variation.) • At the vast majority of SNP locations, there are only 2 possible nucleotides: • major allele (more common) • minor allele (less common). • From each parent, may inherit either allele; SNP unaffected by which received from whom. • Genotype for each SNP: #minor alleles (0,1,2).
Genetic Effects • Let i index individuals; j index SNPs. • Let yi denote some outcome of interest. • Simplest model: Population regression is : population mean of the outcome. xij : genotype {0,1,2} of person i for SNP j. j : effect of SNP j. i : effect of residual factors.
Outline Some promises for social science Conceptual framework Discovering genetic effects The power problem Some ways forward Public policy questions
Discovering Genetic Effects • A naïve approach would be to run the regression • Even if one could measure all J SNPs in the genome, would fail the rank condition. • It is standard to instead run K << J separate regressions, for each of K SNPs. • If SNPs uncorrelated, get unbiased estimates. • In fact, issue of identifying causal SNP.
Two Approaches • Candidate gene study (K small) • Specify ex ante hypotheses about a small set of SNPs based on known or believed biological function. • Set significance threshold = .05 / K. • Good approach when hypotheses have strong priors. • Some major early successes: e.g., APOE, ALDH. • Most work in social-science genetics (pre-2013). (Reviews: Ebstein, Israel, Chew, Zhong, and Knafo, 2010; Beauchamp et al., 2011; Benjamin et al., 2012) • Genome-wide association study (K large) • Atheoretical testing of all SNPs measured on the chip (typically 1-2.5 million). • Set significance threshold = 5 10-8 (since approximately 1 million independent SNPs in genome). • Now the norm in medical-genetics research.