Download
1 / 7
70 likes | 183 Vues
This paper presents an in-depth exploration of clustering methods applied to barcode data using the Weighted Chinese Restaurant Process (WCRP). It discusses various clustering techniques, including hierarchical and non-hierarchical methods like K-means and PAM. We introduce the WCRP framework, detailing how it enables partitioning and approximates posterior distributions. Furthermore, we highlight data visualization approaches and methods such as multidimensional scaling and projection pursuit for effective analysis. The findings contribute significantly to the fields of cluster analysis and data representation.

E N D
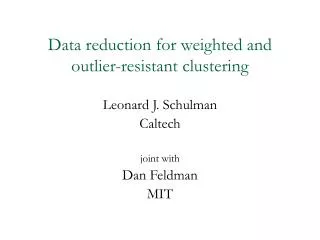
Weighted Chinese Restaurant Process for clustering barcodes Javier Cabrera John Lau Albert Lo DIMACS, Bristol U, and HKUST
Cluster Analysis: • Group the observations into k distinct natural groups. • Non Bayesian Cluster Analysis: • Hierarchical clustering: Build a hierarchical tree • - SIMILARITY: Inter point distance: Euclidean, Manhattan… • - Inter cluster distance: Single Linkage, Complete, Average, Ward • Build a hierarchical tree • Non Hierarchical clustering: • K-means • Divisive • PAM • Model Based • Many Other Methods
HierarchicalClustering 1 2 3 4 Specimen 1 Specimen 2 Specimen 3 Specimen 4 Specimen 5 Specimen 6 Specimen 7 6 5 7
Weighted Chinese Restaurant Process • The Restaurant is full of tables. • 2. Customers are sited on tables by a sitting rule. • 3. Customers are allowed to move from one table to another or to a new empty one. • Partition: Each sitting arrangement for all the customers in the restaurant. 1 2 3 4 6 5 7
Partitions: p : Partition of specimens into species. pP : {Space of all possible partitions. All arrangements of specimens into species} Bayes basics: Prior Distribution: π(p) Likelihood: f(x|p) = 1in(p) k(xj, jCi). Posterior: π(p|data) f(x|p) π(p)
Weighted Chinese Restaurant Process • Approximate Posterior distribution with WCRP • Run the process for a while and obtain frequency table of partitions visited. • Estimate final partition with posterior mode. • Compare posterior probabilities of most probable partitions. • New Specimens: • Placed in one existing table. • Open a new table=>New Species 1 2 3 4 6 5 7
Future Work • WCRP Algorithm for Barcode data: • Data Visualization: • Final partition => similarities => Euclidean Representation • Multidimensional Scaling • Multivariate Data Visualization (used in taxonomy) • Projection Pursuit • Entropy scanning • Lo (1984), Ishwaran and James (2003b), Cabrera, Lau, Lo (2006) • Javier Cabrera cabrera@stat.rutgers.edu • John Lau john.lau@bristol.edu.uk • Albert Lo imaylo@ust.hk