Download
1 / 32
390 likes | 998 Vues
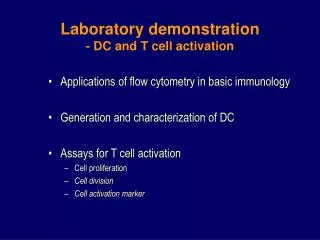
Laboratory demonstration - DC and T cell activation. Applications of flow cytometry in basic immunology Generation and characterization of DC Assays for T cell activation Cell proliferation Cell division Cell activation marker. Applications of Flow Cytometry in Basic Immunology.

E N D
Laboratory demonstration - DC and T cell activation • Applications of flow cytometry in basic immunology • Generation and characterization of DC • Assays for T cell activation • Cell proliferation • Cell division • Cell activation marker
Applications of Flow Cytometry in Basic Immunology • Basic parameters • Applications • Cell phenotyping • Measurement of cell activation • Visualization of cell division • Detection of intracellular molecues (e.g. cytokine) • Analysis of specific ligand binding • Analysis of intracellular calcium concentration • Analysis of DNA content • Cell sorting
Flow cytometry - the basic parameters • FSC (forward scatter) - Size • SSC (side scatter) - Granularity • FL (flurochrome) – FL-1,FL-2,FL-3 etc.
(1) FSC – the size Forward (parallel) lights
(2) SSC – the granularity Side (angled) lights
(3) Fluorescent-labeled markers Laser light Band Filters Fluorescent detectors FL-1 (green) mirrors FL-2 (red) FL-3 (ultra red)
Human blood cells analyzed by their FSC and SSC properties Total blood RBC lysed SSC (granularity) FSC (size)
Immuno-staining of cell surface markers DirectIndirect
Human blood leukocytes (back-gating analysis) CD14-FITC SSC CD45-PE FSC
Human PBL phenotyping SSC Anti-CD19-PE Anti-CD4-PE FSC Anti-CD3-FITC Anti-CD3-FITC Isotype-PE Anti-CD56/16-PE Anti-CD8-PE Isotype-FITC Anti-CD3-FITC Anti-CD3-FITC
CD4 and CD8 expression on thymocytes, splenocytes and PBL Thymocytes Splenocytes PBL CD4-Cyt5 CD8-FITC
Regulatory T cells (triple stain) SSC CD45RC SBT CT Regulatory T cell: CD45RClo CD4+ CD25+ CD4 CD25 (courtesy of Dr. Lina Tian)
Analysis of cell division by CFSE labeling Cell incubation with CFSE (serum free, 37 0C, 10mins. & wash) CFSE crosses cell membrane & attaches to cytoplasmic proteins Removal of carboxyl groups of CFSE by intracellular esterase Fluorescein Analyed by FC Excitation wave length: 488nm Emitting wave length: 519nm 1 ½ ¼ . . . CFSE:Carboxyfluorescein diacetate Succinimidyl Ester
Visualizing B cell division CFSE intensity
Laboratory demonstration - DC and T cell activation • Applications of flow cytometry in basic immunology • Generation and characterization of DC • Assays for T cell activation • Cell proliferation • Cell division • Cell activation marker
Mitogen (Con A)-induced T cell proliferation (measured by level of DNA synthesis)
Cell activation and proliferation analyzed by the FSC and SSC properties UnstimulatedCon A-stimulated Dot plots SSC (granularity) Density plots FSC (size)
T cell activation analyzedby CD25 (IL-2Ra) expression UnstimulatedCon A-stimulated Cell number CD25-PE SSC FSC
Unstimulated Con A-stimulated CFSE-labeled unlabeled Visualizing T cell activation Cell number SSC (granularity) FSC (size) CFSE intensity
Visualizing & Phenotyping T cell Division A B A B Cell number CD25-PE CFSE intensity
Mitogen-induced T cell proliferation, division vs IL-2Ra (CD25) expression UnstimulatedCon A-stimulated CD25 CFSE intensity
DC:T cell interaction (Huang YG, unpublished data)
- LPS + LPS Isotype Isotype MHC Class II CD40 14.0 67.2 CD80 CD86
DC maturity & APC activity in Mixed Lymphocyte Reaction (MLR) Mature DC Immature DC
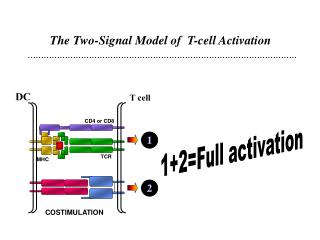
Key points for discussions • Requirements for naïve T cell activation? • Key changes during DC maturation? • Association of DC maturity with APC activity? • Induction and measurement of T cell activation – the basis - cell proliferation assay? - indicators of T cell activation? - T cell mitogen? • MLR - peptides presented to T cells in: - allogenic responses? - semi-allogenic responses? - syngenic responses?
GM-CSF GM-CSF+IL-4 GM-CSF + IL-4GM-CSF + IL-4 (TW) (TW + LPS) Isotype Isotype MHC Class II CD40 7.2 14.0 48.7 67.2 CD80 CD86