Logical Frameworks for Effective Project Management
250 likes | 431 Vues
Learn the importance of Logical Frameworks in project development, how to create LogFrame descriptions, develop indicators, and apply causal logic modeling. Understand the tools for systematic project planning, risk assessment, and progress measurement.

Logical Frameworks for Effective Project Management
E N D
Presentation Transcript
Module 3: Conceptual Design (Part 2) – The Logical Framework We would like to acknowledge the support of the Project Management Institute and the International Institute for Learning, Inc. for permitting the use of their intellectual property in this curriculum.
Module 2 Objectives By the end of this module you will be able to: • Explain why Logical Frameworks are useful in the development context • Develop LogFrame description statements that reflect causal logic • Develop indicators that correspond to the LogFrame description statements
Exercise • What experience do you have working with Logical Frameworks? • For what purposes have you used Logical Frameworks?
Purposes of a Logical Framework • A systematic tool – • for designing, planning, implementing, and monitoring and evaluating a project (or program). • A tool for organizing thinking— • for relating inputs to the implementation of activities, activities to the production of outputs, outputs to the achievement of a defined purpose, and purpose to a high-level goal or impact. • A tool for identifying and assessing risks — • by listing critical assumptions inherent in project design and implementation. • A tool for measuring project progress — • through objectively verifiable indicators and means of verification. • A tool for developing consensus and communicating a project’s intent and strategy
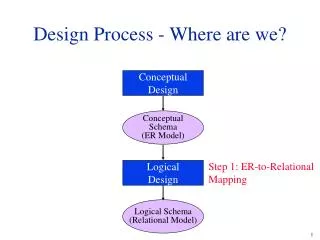
Causal Logic Modeling • Causal Logic Modeling • A systematic tool that visually shows, through a graphic illustration or picture, how a particular initiative occurs through logical relationships.
LogFrame Variations Don’t over-focus on the language and the variations of the various LogFrame matrix models. The important lesson is to learn to think through projects using a logic model.
The Logic of LogFrames (Part 1) If the OBJECTIVES are accomplished; Then this should contribute to the overall goal If DELIVERABLES are produced; Then the OBJECTIVES are accomplished If the ACTIVITIES are conducted; Then RESULTS can be produced If adequate RESOURCES/INPUTS are provided; Then the ACTIVITIES can be conducted
Writing Description Statemetns The broad development impact to which the project contributes – at a national or sector level Statement Wording: “To contribute to…” The development outcome at the end of the project – more specifically the expected benefits to the target group(s) Statement Wording: “Increased, improved, etc.” The direct/tangible results (goods &services) that the project delivers, and which are largely under project management control Statement Wording: “delivered/produced/conducted, etc.” The tasks (work program) that need to be carried out to deliver the planned results Statement Wording: “Prepare, design, construct, research, etc.”
The Logic of LogFrames (Part 2) If the horizontal logic is followed AND assumptions hold true; Then the project will likely succeed.
Identifying Assumptions Goal: To contribute to improved health, particularly of under 5s Assumption(s) Objective(s) Improved river water quality Assumption(s) Outcome 1 Reduced volume of fecal waste discharged into the river system
Illustrative Assumptionspartial build out Goal Objectives/Outcomes Deliverables/Outputs Activities
Adding Indicators DEFINITIONS “an instrument which gives you information” The English Language Dictionary “A quantitative or qualitative factor or variable that provides a simple and reliable means to measure achievement, to reflect changes connected to an intervention, or to help assess the performance of a development actor” OECD/DAC (DAC Glossary of Key Terms in Evaluation, May 2002) • “a variable, which purpose it is to measure change in a phenomena or process”USAID • “a description of the project’s objectives in terms of quantity, quality, target group(s), time and place”OECD
Direct vs. Indirect Indicators • Direct indicators • These indicators directly pinpoint at the subject of interest. This is often the case with operational and more technical subjects. What the manager wants to know, can be (and generally is) measured directly. • Indirect indicators (Proxy indicators) • Indirect indicators (or proxy-indicators) refer in an indirect way to the subject of interest. There can be several reasons to formulate indirect indicators: • The subject of interest cannot be measured directly. This is particularly the case for more qualitative subjects, like behavioral change, etc.; • The subject of analysis can be measured directly, but it is too sensitive to do so, for example level of income, “safe sex”, etc.; • The use of an indirect indicator can be more cost-effective than the use of a direct one. An indirect indicator may very well represent the right balance between level of reliability of information and the efforts needed to obtain the data.
Avoid Reinventing the Wheel Considerable efforts to formulate indicators are being undertaken in most of the programmatic areas of international development, relief and conservation. Some of these might be led by donors, interagency initiatives, NGOs that specialize in Monitoring and Evaluation, and within your agencies. When developing indicators for the Delta River case, for example, the FANTA Project has a technical assistance document that focuses on impact indicators for Water and Sanitation. http://www.fantaproject.org/downloads/pdfs/watsan.pdf
Source of Verification (SoV) Discussions on the Source of Verification for indicators (where to find the information or how to collect it)often lead to: • Reformulation of the indicator. • In the worst case that the information referred to in the indicator cannot be obtained, the indicator becomes useless and a new one should be formulated.
Output Indicators & SoVs Questions Answered: “How will we know if the deliverables have been delivered?” Include appropriate details about quantity, quality and time.
Objectives Indicators & SoVs Questions Answered: “How will we know if the Objective(s) have been delivered?” Include appropriate details about quantity, quality and time.
A LogFrame Matrix Examplepartial build out Goal Objectives/Outcomes Deliverables/Outputs Activities