Download
1 / 1
10 likes | 178 Vues
KOLAM : A Software Platform for Interactive Visualisation & Analysis of High Resolution Microscopy Imagery. Anoop Haridas 1 , Joshua Fraser 1 , Kannappan Palaniappan 1 1 Department of Computer Science, University of Missouri-Columbia, Columbia MO 65211-2060, USA.

E N D
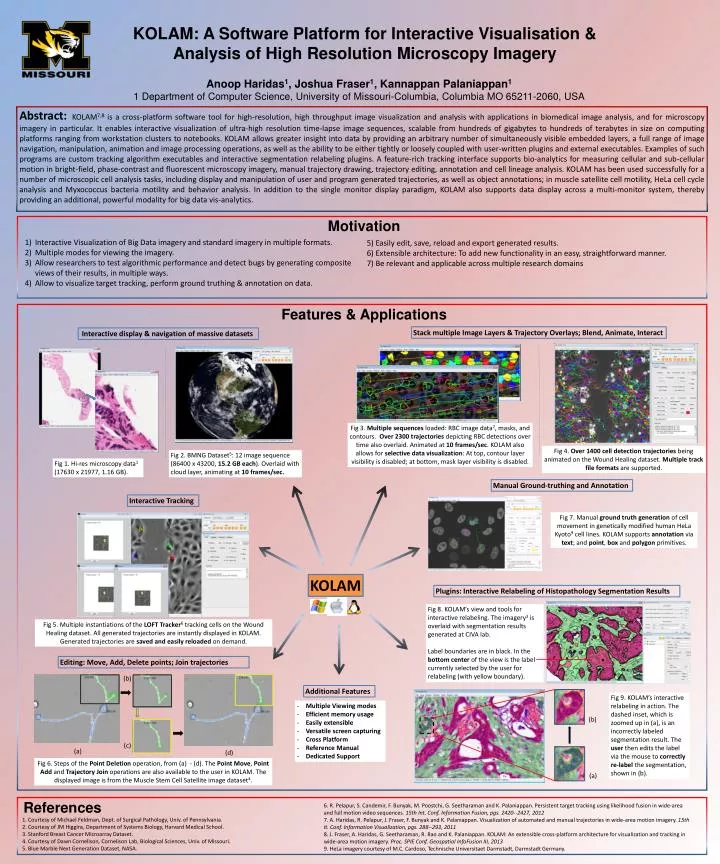
KOLAM: A Software Platform for Interactive Visualisation & Analysisof High ResolutionMicroscopyImagery Anoop Haridas1, Joshua Fraser1, Kannappan Palaniappan1 1 Department of Computer Science, University of Missouri-Columbia, Columbia MO 65211-2060, USA Abstract: KOLAM7,8is a cross-platform software tool for high-resolution, high throughput image visualization and analysis with applications in biomedical image analysis, and for microscopy imagery in particular. It enables interactive visualization of ultra-high resolution time-lapse image sequences, scalable from hundreds of gigabytes to hundreds of terabytes in size on computing platforms ranging from workstation clusters to notebooks. KOLAM allows greater insight into data by providing an arbitrary number of simultaneously visible embedded layers, a full range of image navigation, manipulation, animation and image processing operations, as well as the ability to be either tightly or loosely coupled with user-written plugins and external executables. Examples of such programs are custom tracking algorithm executables and interactive segmentation relabeling plugins. A feature-rich tracking interface supports bio-analytics for measuring cellular and sub-cellular motion in bright-field, phase-contrast and fluorescent microscopy imagery, manual trajectory drawing, trajectory editing, annotation and cell lineage analysis. KOLAM has been used successfully for a number of microscopic cell analysis tasks, including display and manipulation of user and program generated trajectories, as well as object annotations; in muscle satellite cell motility, HeLa cell cycle analysis and Myxococcus bacteria motility and behavior analysis. In addition to the single monitor display paradigm, KOLAM also supports data display across a multi-monitor system, thereby providing an additional, powerful modality for big data vis-analytics. Motivation Interactive Visualization of Big Data imagery and standard imagery in multiple formats. Multiple modes for viewing the imagery. Allow researchers to test algorithmic performance and detect bugs by generating composite views of their results, in multiple ways. Allow to visualize target tracking, perform ground truthing & annotation on data. 5) Easily edit, save, reload and export generated results. 6) Extensible architecture: To add new functionality in an easy, straightforward manner. 7) Be relevant and applicable across multiple research domains Features &Applications Stack multiple Image Layers & Trajectory Overlays; Blend, Animate, Interact Interactive display & navigation of massive datasets Fig 3. Multiple sequences loaded: RBC image data2, masks, and contours. Over 2300 trajectories depicting RBC detections over time also overlaid. Animated at 10 frames/sec. KOLAM also allows for selective data visualization: At top, contour layer visibility is disabled; at bottom, mask layer visibility is disabled. Fig 4. Over 1400 cell detection trajectories being animated on the Wound Healing dataset. Multiple track file formats are supported. Fig 2. BMNG Dataset5: 12 image sequence (86400 x 43200, 15.2 GB each). Overlaid with cloud layer, animating at 10 frames/sec. Fig 1. Hi-res microscopy data1(17630 x 21977, 1.16 GB). Manual Ground-truthing and Annotation Interactive Tracking Fig 7. Manual ground truth generation of cell movement in genetically modified human HeLa Kyoto9 cell lines. KOLAM supports annotation via text; and point, box and polygon primitives. KOLAM Plugins: Interactive Relabeling of Histopathology Segmentation Results Fig 8. KOLAM’s view and tools for interactive relabeling. The imagery3 is overlaid with segmentation results generated at CIVA lab. Label boundaries are in black. In the bottom center of the view is the label currently selected by the user for relabeling (with yellow boundary). Fig 5. Multiple instantiations of the LOFT Tracker6 tracking cells on the Wound Healing dataset. All generated trajectories are instantly displayed in KOLAM. Generated trajectories are saved and easily reloaded on demand. Editing: Move, Add, Delete points; Join trajectories (b) Additional Features Fig 9. KOLAM’s interactive relabeling in action. The dashed inset, which is zoomed up in (a), is an incorrectly labeled segmentation result. The user then edits the label via the mouse to correctly re-label the segmentation, shown in (b). • Multiple Viewing modes • Efficient memory usage • Easily extensible • Versatile screen capturing • Cross Platform • Reference Manual • Dedicated Support (b) (c) (a) (d) Fig 6. Steps of the Point Deletion operation, from (a) - (d). The Point Move, Point Add and Trajectory Join operations are also available to the user in KOLAM. The displayed image is from the Muscle Stem Cell Satellite image dataset4. (a) • References 6. R. Pelapur, S. Candemir, F. Bunyak, M. Poostchi, G. Seetharaman and K. Palaniappan. Persistent target tracking using likelihood fusion in wide-area and full motion video sequences. 15th Int. Conf. Information Fusion, pgs. 2420--2427, 2012 7. A. Haridas, R. Pelapur, J. Fraser, F. Bunyak and K. Palaniappan. Visualization of automated and manual trajectories in wide-area motion imagery. 15th It. Conf. Information Visualization, pgs. 288--293, 2011 8. J. Fraser, A. Haridas, G. Seetharaman, R. Rao and K. Palaniappan. KOLAM: An extensible cross-platform architecture for visualization and tracking in wide-area motion imagery. Proc. SPIE Conf. Geospatial InfoFusion III, 2013 9. HeLa imagery courtesy of M.C. Cardoso, Technische Universitaet Darmstadt, Darmstadt Germany. • 1. Courtesy of Michael Feldman, Dept. of Surgical Pathology, Univ. of Pennsylvania. • 2. Courtesy of JM Higgins, Department of Systems Biology, Harvard Medical School. • 3. Stanford Breast Cancer Microarray Dataset. • 4. Courtesy of Dawn Cornelison, Cornelison Lab, Biological Sciences, Univ. of Missouri. • 5. Blue Marble Next Generation Dataset, NASA.