Download
1 / 25
250 likes | 391 Vues
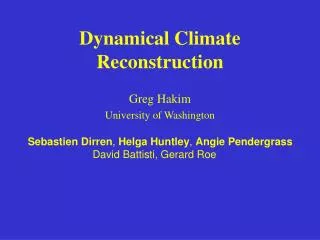
A dynamical reconstruction of detailed atmospheric and related regional variability, 1958-2000. Hans von Storch, Frauke Feser, Ralf Weisse, Arnt Pfizenmayer, Katja Woth, Insa Meinke, Mariza Cabral, Charlotte Hagner, Hilmar Messal

E N D
A dynamical reconstruction of detailed atmospheric and related regional variability, 1958-2000. Hans von Storch, Frauke Feser, Ralf Weisse, Arnt Pfizenmayer, Katja Woth, Insa Meinke, Mariza Cabral, Charlotte Hagner, Hilmar Messal Institute for Coastal Research, GKSS Research Center, Geesthacht, Germany Wroclaw, 27. June 2003
The basic atmospheric reconstruction; dynamical downscaling, spectral nudging, validation • Applications – storms, (waves), lead transport, run-off • Scenarios of plausible future change
Institut für Küstenforschung I f K Concept of Dynamical Downscaling RCM Physiographic detail 3-d vector of state Known large scale state projection of full state on large-scale scale Large-scale (spectral) nudging
Spectral nudging vs. standard formulation Large scale Medium scale Large scale Medium scale
Institut für Küstenforschung I f K Spectral nudging vs. standard formulation Similarity of zonal wind at 850 hPa between simulations and NCEP re-analyses large scales medium scales standard formulation large-scale nudging
Institut für Küstenforschung I f K Spectral nudging vs. standard formulation
Mean monthly precipitation [mm/month] for 1999. NCEP REMO HIPOCAS meeting Madrid Atmospheric fields REMO 5.0 run GKSS Frauke Feser
Institut für Küstenforschung I f K Spectral nudging vs. standard formulation
Extreme wind speeds Southern North Sea Feser, pers. comm. DWD REMO 20-year return values of wind speed, based on daily 1992-97 data (color codes) plus from station data in NL (numbers in black)
Institut für Küstenforschung I f K Skill in representing marine winds significant wave height [days] wave direction [days] Red: buoy,yellow: radar, blue: wave model run with REMO winds Gerd Gayer, pers. comm., 2001
1955 1995 1955 Estimatedlead emissions (from Pacyna and Pacyna, 2000) 1975
1995 Calculated depositions deposition
Institut für Küstenforschung I f K model estimate
Hillmar Messal, 2003 Analysis REMO simulation difference
REMO simulation (forced with NCEP gobal re-analysis) Arnt Pfizenmayer, pers. comm., 2003
Precipitation in the Odra catchment Hillmar Messal, pers. comm.
A1 A world of rapid economic growth and rapid introduction of new and more efficienttechnology. A very heterogeneous world with an emphasis on family values and local traditions. A world of “dematerialization” and introduction of clean technologies. A world with an emphasis on local solutions to economic and environmental sustainability. “ business as usual ” scenario (1992). A2 B1 B2 Institut für Küstenforschung IS92a I f K “SRES” ScenariosSRES = IPCC Special Report on Emissions Scenarios IPCC, 2001
Scenario for changing precipitation in summer at the end of the 21st century Christensen and Christensen, 2003, nature Change (%) in mean summer precipitation total in 99% quantile 5-daily precipitation amounts (rare events)
Wind statistics, A2-scenario for 2070-2100SMHI RCAO Ralf Weisse, 2003
Conclusions • Multi-decade reconstruction of hourly weather on 50 km grid in all of Europe available, 1958-2002. • Several aspects checked but far from complete validation. Wind over the sea ok. Broad features of precip, cloudiness ok as well, but other quantities unknown. • Data (wind, precip, temp ….) may be used to reconstruct various other environmental conditions, such as ocean waves, storm surges, flooding, extreme events, long range transport of matter. • Data freely available for other research groups. • Polish groups welcome to validate, and use, data in particular with respect to Polish territory.
Reconstruction of past decades (and longer) regional and local environmental conditions relevant … • For determination of extreme events (frequency (Poison?), intensity) in terms of weather and impact variables. Preparation of adequate adaptation measures. Minimizing weather related risks. • Basis of reconstruction of historical climate (transfer functions; proxy data; historical data). • A posteriori analysis of past political regulations (example: lead, but also: flood protection). • Determination of range of „normal“ variations, in order to discriminate between natural climate variability and man-made climate change („detection and attribution“).