Starting a Landscaping Business: Navigating Pricing and Supply
Venture into the landscaping business by understanding pricing and supply dynamics. Begin with neighbors willing to pay varying amounts for your services: $30 weekly for comprehensive care, $20 for less frequent visits, and $10 for minimal service. As you grow your operation with better equipment, changes in fuel prices may impact your supply capabilities. Learn how these factors influence your business strategy and supply curve shifts, maintaining a balance between demand and your production capacity.

Starting a Landscaping Business: Navigating Pricing and Supply
E N D
Presentation Transcript
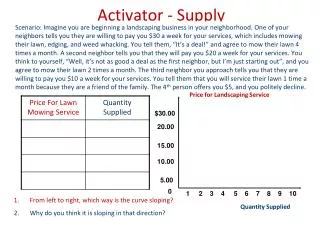
Price for Landscaping Service Quantity Supplied Activator - Supply Scenario: Imagine you are beginning a landscaping business in your neighborhood. One of your neighbors tells you they are willing to pay you $30 a week for your services, which includes mowing their lawn, edging, and weed whacking. You tell them, “It’s a deal!” and agree to mow their lawn 4 times a month. A second neighbor tells you that they will pay you $20 a week for your services. You think to yourself, “Well, it’s not as good a deal as the first neighbor, but I’m just starting out”, and you agree to mow their lawn 2 times a month. The third neighbor you approach tells you that they are willing to pay you $10 a week for your services. You tell them that you will service their lawn 1 time a month because they are a friend of the family. The 4th person offers you $5, and you politely decline. $30.00 20.00 15.00 10.00 5.00 0 1 2 3 4 5 6 7 8 9 10 • From left to right, which way is the curve sloping? • Why do you think it is sloping in that direction?
Activator - Supply Price for Landscaping Service Quantity Supplied Activator - Supply Scenario: Imagine you are beginning a landscaping business in your neighborhood. One of your neighbors tells you they are willing to pay you $30 a week for your services, which includes mowing their lawn, edging, and weed whacking. You tell them, “It’s a deal!” and agree to mow their lawn 4 times a month. A second neighbor tells you that they will pay you $20 a week for your services. You think to yourself, “Well, it’s not as good a deal as the first neighbor, but I’m just starting out”, and you agree to mow their lawn 2 times a month. The third neighbor you approach tells you that they are willing to pay you $10 a week for your services. You tell them that you will service their lawn 1 time a month because they are a friend of the family. The 4th person offers you $5, and you politely decline. $30.00 20.00 15.00 10.00 5.00 0 1 2 3 4 5 6 7 8 9 10 • From left to right, which way is the curve sloping? • Why do you think it is sloping in that direction? Upward Price goes up, you are willing to supply more
Chapter 5 - SupplySection 1 – Understanding Supply • Supply – the amount of good and services that sellers are willing and able to sell in the marketplace • The amount of a product that can be offered for sale at all possible prices that could prevail in the market
The Law of Supply • Law of Supply – the higher the price offered, the larger the quantity produced by the supplier; the lower prices offered, the lower quantity supplied • Direct (positive) relationship between price and the QS of a product. (push up example) PriceAs Prices Increase SupplyQuantity Supplied Increases Price AsPrices Fall Supply Quantity Supplied Falls
The Law of Supply Reason for law of supply: • Increased Production - Suppliers will produce more in order to earn additional revenue
Price per slice of pizza $3.00 2.50 2.00 1.50 1.00 0.50 0 100 150 200 250 300 350 Quantity Supplied of Slices of Pizza • Supply Schedule - a table that lists the quantity supplied of a good that a specific supplier will produce at each price in a market • Market Supply Schedule - lists the quantity supplied of a good that all firms will produce at each price in the market • Supply Curve - A graphic representation of the individual or market supply schedule The Supply Schedule and Curve
Application – Changes in Supply Price $30.00 20.00 10.00 0 1 2 3 4 5 6 7 8 9 10 Quantity Supplied Scenario: You have been producing for a number of months at the same rate in your landscaping business. In fact, many of your neighbors have requested your services. However, you have previously been unable to fulfill their demand for your services because you are still a full time student and you have to share your time running your business with your time at school. However, the past three months of revenue have allowed you to upgrade your lawnmower from a push to a riding lawnmower. You also recently purchased a gas powered weed whacker and edger. This allows you to more than double your production rate as a result of increased efficiency. Unfortunately, a month into your new production rates gas prices triple. This causes you to have to cut back on production and decrease your supply. Plot the new supply schedules on your supply curve. S3 S1 S2
Section 3 - Shifts of the Supply Curve Price • Changes in supply are reflected on the Supply Graph as a shift in the curve • Shifts to the right indicate an increase in supply • Shifts to the left indicate a decrease in supply Increase in supply Decrease in supply S 2 S 3 S 1 0 Quantity Supplied
Difference Between A Change in Quantity Supplied and a Change in Supply • QS - A change in the amount a supplier will produce as a result of a change in price • Reflected as movement along the curve • S – A change in the amount a supplier can produce as a result of a change in Ceteris Peribus (i.e. investment in new machinery in lawn business) • Reflected as a shift in the curve
Effects of Rising Costs • Input Prices – the cost of production based on the materials necessary to produce (inputs) • Increase in input prices will cause a reduction of production • Decrease in input prices will cause incentive to produce and increase supply
Technology • Technology – ability to produce based on capital goods and technological knowledge • Increases in ability to produce as technology improves • Decrease as a result of faulty technology or breakdowns
Subsidies • Subsidy – a government payment that supports a business or market • Increases in ability to produce as a result of increased subsidies • Decrease as a result of reduced subsidies
Taxes • Excise tax – tax on the production or sale of a good that is harmful to the consumer • Increases in ability to produce as government removes taxes • Decrease in ability to produce as government imposes taxes
Regulation • Regulation – government intervention in a market that affects the price, quantity or quality of a good. • Increases in ability to produce as government deregulates • Decrease in ability to produce as government increases regulation
Future Expectations of Prices • Expectations – refers to the way suppliers think about the future, as it relates to production • Negative expectations for the future of a market can cause suppliers to reduce supply in the short term • Positive speculation for the future of a market can cause suppliers to increase supply and bring more suppliers to the market
Number of Sellers • Number of sellers – an increase in the number of sellers can cause an increase or decrease in the supply of goods and services • Increase in sellers, increase in production • Decrease in sellers, decrease in production
Determinants of SupplyWhat Causes a Shift? pg. 116-120 A fall in the cost of inputs (raw materials) will allow more supply to be produced A rise in the cost of inputs (machines, labor, etc.) will reduce supply Robots have replaced human workers on assembly lines, email improves communication. Breakdowns in technology can reduce supply. Payments to farmers create incentive to continue to produce Reduced incentives when government removes subsidies Excise taxes increases costs and reduces supply Removal of taxes decreases costs and increases supply Government intervention increases costs and reduces supply Government deregulation decreases costs and increases supply
Application – Average Supply of Specialty Coffee in Southeast Georgia • Plot the supply schedules below on the same graph. The schedules represents the market supply for coffee during the early 2000’s at various price points. During the late 2000’s the demand for specialty coffee became increasingly popular. As a result a number of companies such as McDonalds and Joe’s Coffee entered the marketplace. During the late 2000’s, the federal government placed major taxes on coffee beans, which increased a the cost for a basic input and had an effect on specialty coffee suppliers.
Price $3.00 1.50 1.00 .50 0 2 4 6 8 10 12 Quantity Supplied Application – Shift in Market Supply Curve S2 S3 S1 2.50 2.00
What Causes a Shift in Supply?Determinants of Supply • Effects of Rising Costs • Technology • Subsidies • Taxes • Regulations • Future Expectations of Prices • Number of Suppliers • Group Assignment (pg. 116-120): • Create a skit that represents one of the six determinants of supply. • You must show how your determinant can increase and decrease supply.
Price per Elmo 25.00 20.00 15.00 10.00 5.00 0 1 2 3 4 5 6 7 8 9 10 11 12 13 14 15 Quantity of Elmos Activator – Chapter 6 Section 1 Plot the schedule below, which represents the willingness of stores to purchase Tickle Me Elmo (in the millions per month) during the 1996 holiday season Formula – QS - QD 30.00 Surplus Equilibrium Point/Market Clearing Price(Pe/Qe) Shortage S D
Price per Elmo 25.00 20.00 15.00 10.00 5.00 0 1 2 3 4 5 6 7 8 9 10 11 12 13 14 15 Quantity of Elmos Plot the schedule below Activator – Combining Supply and Demand Formula = QS - QD 30.00 Surplus Equilibrium Point/Market Clearing Price(Pe/Qe) Shortage S D
Combining Supply and Demand • Price – the monetary value of a product as established by supply and demand • A link between producers and consumers • Helps to determines the What, How and For Whom to produce
Defining Equilibrium • Equilibrium – the point of balance where demand and supply come together at the same number • Also Known as the market clearing price • QD = QS • Prices are relatively stable
Disequilibrium • Disequilibrium – occurs when the quantity supplied is not equal to the quantity demanded • QD < QS • QD > QS
Excess Demand • Excess Demand – quantity demanded is greater than quantity supplied • Shortage – not enough of a product to satisfy the amount demanded by the consumer • QD > QS • Shortages force prices up
Price 40.00 30.00 20.00 10.00 5.00 0 1 3 5 7 9 11 13 15 17 19 21 23 25 Quantity Application – The Effects of a Change in Demand Plot the schedule below, which represents market supply and demand and the effects of a change in demand. 50.00 New Equilibrium Price/Quantity S D1 D2
Excess Supply • Excess Supply – quantity supplied is more than quantity demanded • Surplus – excess product above what is used or needed • QD < QS • Surpluses force prices down
Price 40.00 30.00 20.00 10.00 5.00 0 1 3 5 7 9 11 13 15 17 19 21 23 25 Quantity Application – The Effects of a Change in Supply Plot the schedule below, which represents market supply and demand and the effects of a change in supply. 50.00 New Equilibrium Price/Quantity S1 S2 D
Law of Supply and Demand • Law of supply and demand – the price of any good adjusts to bring the quantity supplied and the quantity demanded for that good into balance • Shortages/Surpluses are short-lived market conditions
Supply and Demand Model Practice • Answer the following on a separate sheet of paper • Suppose we are analyzing the market for hot chocolate. • Winter starts and the weather turns sharply colder. • The price of cocoa beans, an ingredient in making hot chocolate, decreases. • The Surgeon General of the United States announces that hot chocolate causes acne. • Protesting farmers stop producing millions of gallons of milk. S D
Supply and Demand Model Practice • Answer the following on a separate sheet of paper • Suppose we are analyzing the market for hot chocolate. • Winter starts and the weather turns sharply colder. • The price of cocoa beans, an ingredient in making hot chocolate, decreases. • The Surgeon General of the United States announces that hot chocolate causes acne. • Protesting farmers stop producing millions of gallons of milk. (e) (d) (f) S D
Supply and Demand Review Decrease - QD Increase - QS Movement Increase - QD Decrease - QS Movement Increase - D Shift Right Increase - S Shift Right Increase - QS Movement along S Curve Increase - D Shift Right Increase - S Shift Right Shift Left Decrease - S
Survey, Question, Read, wRite, RespondPage 139 - 143 • SQ3R • Prices in the Free Market • Q: How are Prices important to the free market? • A: Serve as a vital role in the economy. Help put a value on products and provide a wide range of goods at various prices. • The Advantage of Prices • Price as an Incentive • Prices as Signals • Flexibility • Price System Is “Free” • A Wide Choice of Goods • The Black Market • Efficient Resource Allocation • Prices and the Profit Incentive
5.00 4.00 3.00 2.00 1.00 0 10 20 30 40 50 60 Activator Chapter 6 Plot the schedule below, which represents the demand for bottled water after a hurricane. S 6.00 Price Ceiling D
Supply, Demand, and Government Policies • Price Ceiling – government imposed, legal maximum price that can be charged for a good/service • New York introduced rent control in the early 1940s as a way to provide affordable housing • Price ceiling causes a shortage in the amount of the product
In praise of price gougingBy John StosselPoliticians and the media are furious about price increases in the wake of Hurricane Katrina. They want gas stations and water sellers punished. If you want to score points cracking down on mean, greedy profiteers, pushing anti-"gouging" rules is a very good thing. But if you're one of the people the law "protects" from "price gouging," you won't fare as well. Consider this scenario: You are thirsty — worried that your baby is going to become dehydrated. You find a store that's open, and the storeowner thinks it's immoral to take advantage of your distress, so he won't charge you a dime more than he charged last week. But you can't buy water from him. It's sold out. You continue on your quest, and finally find that dreaded monster, the price gouger. He offers a bottle of water that cost $1 last week at an "outrageous" price — say $20. You pay it to survive the disaster. You resent the price gouger. But if he hadn't demanded $20, he'd have been out of water. It was the price gouger's "exploitation" that saved your child. It saved her because people look out for their own interests. Before you got to the water seller, other people did. At $1 a bottle, they stocked up. At $20 a bottle, they bought more cautiously. By charging $20, the price gouger makes sure his water goes to those who really need it. The people the softheaded politicians think are cruelest are doing the most to help. Assuming the demand for bottled water was going to go up, they bought a lot of it, planning to resell it at a steep profit. If they hadn't done that, that water would not have been available for the people who need it the most.
Might the water have been provided by volunteers? Certainly some people help others out of benevolence. But we can't count on benevolence. As Adam Smith wrote, "It is not from the benevolence of the butcher, the brewer or the baker, that we can expect our dinner, but from their regard to their own interest.” Consider the storeowner's perspective: If he's not going to make a big profit, why open up the store at all? Staying in a disaster area is dangerous and means giving up the opportunity to be with family in order to take care of the needs of strangers.Why take the risk? Any number of services — roofing, for example, carpentry, or tree removal — are in overwhelming demand after a disaster. When the time comes to rebuild New Orleans, it's safe to predict a shortage of local carpenters: The city's own population of carpenters won't be enough.
If this were a totalitarian country, the government might just order a bunch of tradesmen to go to New Orleans. But in a free society, those tradesmen must be persuaded to leave their homes and families, leave their employers and customers, and drive from say, Wisconsin, to take work in New Orleans. If they can't make more money in Louisiana than Wisconsin, why would they make the trip?Some may be motivated by a desire to be heroic, but we can't expect enough heroes to fill the need, week after week; most will travel there for the same reason most Americans go to work: to make money. Any tradesman who treks to a disaster area must get higher pay than he would get in his hometown, or he won't do the trek. Limit him to what his New Orleans colleagues charged before the storm, and even a would-be hero may say, "the heck with it.“ If he charges enough to justify his venture, he's likely to be condemned morally or legally by the very people he's trying to help. But they just don't understand basic economics. Force prices down, and you keep suppliers out. Let the market work, suppliers come — and competition brings prices as low as the challenges of the disaster allow.Goods that were in short supply become available, even to the poor. It's the price "gougers" who bring the water, ship the gasoline, fix the roof, and rebuild the cities. The price "gougers" save lives.
6.25 5.25 4.25 2.25 1.00 0 10 20 30 40 50 60 Activator Chapter 6 Plot the schedule below, which represents the demand for laborers in the market. Price Floor S 7.25 D
Government Intervention • Price Floor – government imposed, minimum price that can be legally charged for a good • Minimum wage is a well-known price floor • Minimum wage can cause a surplus in the demand for workers
Application – Price Ceiling Price of Ice Cream Cones Scenario: the government places a price ceiling on ice cream cones as a result of complaints and lobbying from the Ice-Cream Eaters of America. The price ceiling is at $2.00 a cone. Graph the following schedule based on the price points and qs/qd. Equilibrium point $3 Shortage of 50 cones Price ceiling 2 Quantity supplied Quantity demanded Supply 125 75 100 Demand 0 The government imposes a price ceiling of $2. Because the price ceiling is below the equilibrium price of $3, the market price equals $2. At this price, 125 cones are demanded and only 75 are supplied, so there is a shortage of 50 cones. Quantity of Ice-Cream Cones
Application – Price Floor Price of Ice Cream Cones Scenario: the government places a price floor on ice cream cones as a result of complaints and lobbying from the National Organization of Ice-Cream Makers. The price floor is at $4.00 a cone. Graph the following schedule based on the price points and qs/qd. $4 3 Equilibrium point Surplus of Ice Cream Cones Price floor Quantity supplied Quantity demanded Supply 120 80 100 Demand 0 The government imposes a price floor of $4, which is above the equilibrium price of $3. Therefore, the market price equals $4. Because 120 cones are supplied at this price and only 80 are demanded, there is a surplus of 40 cones. Quantity of Ice-Cream Cones
A store sells cheddar cheese by the pound. The schedule reflects the quantity demanded and the quantity supplied for the different prices the cheese could be sold. • Answer the following question: • What is the market price? _________ • What is the quantity demanded at the market price? _______ • What is the quantity supplied at the market price? _________ • On your graph, draw a line across your graph at the price of $4.00. • If the government were to set a price no higher than $4.00, this would be called a __________________________ • Use your answer in (a) to label the line on your graph at the price of $4.00. • At a price of $4.00, the quantity demanded would be __________ • At a price of $4.00, the quantity supplied would be __________ • Is there a surplus or shortage of cheese? _____________ On your graph, draw a line across your graph at the price of $5.50. • If the government were to set a price no lower than $5.50, this would be called a _________________ • Use your answer in (a) to label the line on your graph at the price of $5.50. • At a price of $5.50, the quantity demanded would be _____________ • At a price of $5.50, the quantity supplied would be _____________ • Is there a surplus or shortage of cheese? _____________________ 4.50 280 280 price ceiling 300 240 shortage price floor 240 360 surplus
Tennis Ball Simulation • What workers created the most total output? • What was the highest increase in marginal product of labor? • When did we have too many workers?
Costs of Production • What is the marginal product of labor from one laborer to two?_______________ • What is the marginal product of labor from two laborers to three? ________________ • At what number of laborers does the marginal product of labor start to decline? _________________ • At what number of laborers does the firm experience negative marginal product of labor? ___________
Costs of Production • What is the marginal product of labor from one laborer to two?_______________ • What is the marginal product of labor from two laborers to three? ________________ • At what number of laborers does the marginal product of labor start to decline? _________________ • At what number of laborers does the firm experience negative marginal product of labor? ___________
Costs of Production • What is the marginal product of labor from one laborer to two?_______________ • What is the marginal product of labor from two laborers to three? ________________ • At what number of laborers does the marginal product of labor start to decline? _________________ • At what number of laborers does the firm experience negative marginal product of labor? ___________
Costs of Production • What is the marginal product of labor from one laborer to two?_______________ • What is the marginal product of labor from two laborers to three? ________________ • At what number of laborers does the marginal product of labor start to decline? _________________ • At what number of laborers does the firm experience negative marginal product of labor? ___________