Download

1 / 74
790 likes | 1.07k Vues
Climate Change, Evidences and the Science of Climate Change. M. Shamsul Alam, Ph.D. Department of Geography & Environmental Studies University of Rajshahi, Rajshahi 6205, Bangladesh. Basic Terms

E N D
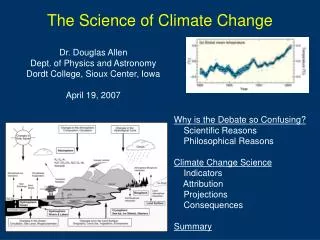
Climate Change, Evidences and the Science ofClimate Change M. Shamsul Alam, Ph.D. Department of Geography & Environmental Studies University of Rajshahi, Rajshahi 6205, Bangladesh.
Basic Terms Weather: the current atmospheric conditions, including temperature, rainfall, wind, and humidity at a given place. Climate: is the general weather conditions over a long period of time., generally 30 or more years average of weather. Factors of Climate: Latitude, elevation, distance from coast line/nearby water, surface type, vegetation, etc. Elements of Weather and Climate: Temp, humidity , pressure, winds, cloud cover, precipitation, fog, visibility, etc. (NOTE: Temperature and Precipitation are the two most important elements)
Climate is defined as "average weather" or the mean physical state of the "climate system", the definition of which has evolved in time (WMO, 1975). The United Nation Framework convention on Climate Change (UNFCC) comes up with the definition in 1992 that the climate system is a combination of the atmosphere, Hydrosphere, Biosphere and Geosphere along with interactions.
Climate Change has been defined by the IPCC as “a change in the state of the climate that can be identified (e.g., by using statistical tests) by changes in the mean and/or the variability of its properties and that persists for an extended period, typically decades or longer. Climate change may be due to natural internal processes or external forcing, or to persistent anthropogenic changes in the composition of the atmosphere or in land use”(IPCC, 2012).
This definition differs from that in the UNFCCC’s earlier definition, where climate change is defined as: “a change of climate which is attributed directly or indirectly to human activity that alters the composition of the global atmosphere and which is in addition to natural climate variability. climate change attributable to human activities altering the atmospheric composition, and climate variability attributable to natural causes.
History of climate change 1898: Swedish scientist Svante Ahrrenius warns carbon dioxide from coal and oil burning could warm the planet 1988: NASA scientist James Hansen tells U.S. Congress global warming "is already happening now'' Exceptional drought hits the USA Creation of the IPCC
1992: UNFCCC aims at stabilising atmospheric concentrations of GHG 1997: UNFCCC parties approve Kyoto Protocol mandating emission cuts by industrial nations 1998/2005: Warmest year since record-keeping began in mid-19th Century Kyoto Protocol takes effect
The work of the IPCC is guided by the mandate given to it by its parent organisations: the World Meteorological Organisation (WMO) and the United Nations Environment Programme (UNEP) Its role is to assess on a comprehensive, objective and transparent basis the scientific, technical and socio-economic information relevant to understanding the scientific basis of climate change, its potential impacts and options for adaptation and mitigation
The assessments carried out by the IPCC have influenced global action • on an unprecedented scale • 1. First Assessment Report (1990) had a major impact in defining the content of the UNFCCC • 2. The Second Assessment Report (1996) was largely influential in defining the provisions of the Kyoto Protocol
3. The Third Assessment Report (2001) focused attention on the problems of the impacts of climate change and the need for adaptation 4. The Fourth Assessment Report (2007) is creating a strong basis for a post Kyoto Protocol agreement
The IPCC`s Report of 2007 claimed that (a) global average surface temperature has increased 0.6°C 0.2°C since the late 19th century, and it increased at a rate of 0.17°C per decade in the last 30 years. (b) most of the warming observed over the last 50 years is attributable to human activities, in particular emissions of the greenhouse gases, and (c) if GHG emissions continue the warming will also continue, with temperature increasing by 1.4°C-5.8°C by the year 2100.
The other effects of increased temperature, as claimed by the IPCC report, are : (a) sea level rise by 9-98 cms. due to thermal expansion of oceans, and melting of polar ice caps and glaciers, (b) submergence of costal lowlands, (c) increased frequency and intensity of tropical cyclones and (d) Increase in severe weather activity.
Last 1000 years temperature estimation by IPCC. This graph is taken from the UNEP/GRID-Arendal site
The figure SPM-5 from the AR4shows temperature projections to 2100: “Solid lines are multi-model global averages of surface warming for the scenarios A2, A1B and B1, shown as continuations of the 20th century simulations. Shading denotes the plus/minus one standard deviation range of individual model annual averages. Surce: IPCC, 2007: Climate Change 2007: Synthesis Report
Now the questions are: • Why the definition of climate change has been changed? • What caused climate change in the past? • Was the change in the historical past occurred due anthropogenic activities even when there was no people on our earth? • Can anthropogenic activities change the atmospheric composition which has a self regulatory mechanism? • How much CO2 is contributed by anthropogenic activities?- evidence is only 0.28%. and there are many more other questions.
According to John R. Christi a fundamental problem with the entire issue “is that climate science is not a classic, experimental science. As an emerging science of a complex climate system, it is pledged by uncertainty and ambiguity in both observations and theory. Looking classic, laboratory results, it easily become hostage to opinion, groupthink, arguments from authority, overstatement of confidence ". Distinguished Professor of Atmospheric Science and Director of Earth System Science Centre, University of Alabama at Hantsville: Alabama State Climatologist: IPCC Lead Author: 2001 TAR ( Third Assessment Report) : Contributor 1992 IPCC Supplement: Contributor 1994 Radiative Forcing of Climate Change: Key Contributor 1995 SAR ( IPCC Second Assessment Report; Contributing Author: IPCC 2007 Report (AR4)- Working Group I & II: NASA Model for Experimental Scientific Achievement: Americal Meteorological Society Special Award for Satellite Observations; Fellow, American Meteorological Society: testified to the US House and Senate Committees for lack of evidence for catastrophic climate change caused by humans: one of the 3 members invited at the meeting on Draft 5th Assessment Report of the IPCC
He further continues " the three fundamental flaws in the current IPPC process are: • the two-step political filter by which Lead Authors are selected, • the review activity granted the Lead Authors who write the chapters and synthesis reports, • the very limited word count available for each topic, which encourages short and overconfident statements about questions that in truth are plainly nasty to deal with" (Christy, 2011: 16, 17).
Evidences Theories about climate change and consequent predictions about what will happen to the Earth’s climate over coming decades have become as much an issue of politics and philosophy as they are an issue of science. Despite assertions to the contrary, there is no consensus among scientists about the causes of climate change. Scientists disagree over what causes the Earth’s climate to change because the mechanisms are unknown or poorly understood, and d, and data are sparse and unreliable.
In order to investigate the magnitudes, causes, and effects of climate changes, longer series of global average temperatures are necessary. The concept of a global average temperature is simple, but in practice it is not so easily estimated from non-satellite data. Inhomogeneities in climate records Climate records (e.g. temperature and precipitation measurements) are affected by changes in measurement conditions, e.g., modernisation of the instrumentation, location of the weather stations, changes in observation rules, automation, etc. These inhomogeneities are of the same order of magnitude as anthropogenic climate
In 273 of the stations examined the homogenization procedure increased positive temperature trends, decreased negative trends or changed negative trends to positive. The expected proportion would be 50%. Homogenization has amplified the estimation of global temperature increase. “homogenation practices used until today are mainly statistical, not well justified by experiments, and are rarely supported by metadata. It can be argued that they often lead to false results: natural features of hydroclimatic times series are regarded as errors and are adjusted.” ( Watts, A., 2012)
Explanation • This graph (after Scotese and Bernier, 2001) shows that over the past 600 my estimated average earth temperature Have fluctuated between 10º-12º C, with average earth’s temperature being about 22º C, or 7º Cwarmer than today. • The graph also shows estimated average Co2 concentrations was significantly higher than present values, 7000 ppm. • Most evidence shows that temperature changes cause changes in CO2 rather than vice versa. On that, more later.
Source: Green K.C ,2008Global Climate changes: Evidences of causes and effects..www.destone.co nz
Images of Norther Hemisphere sea ice, purple colour indicate concentration of ice. Source: Green K.C. ,2008.www.destone.co.nz Global Climate changes: Evidences of causes and effects,
Images of Norther Hemisphere sea ice, purple colour indicate concentration of ice. Source: Green K.C. ,2008. Global Climate changes: Evidences of causes and effects. www.destone.co nz
Antarctic sea ice is increasing despite warming. Source: Zang, 2007. J. of Climate, Vol. 20: 2515-2529.
How much evidence will it take to quiet the claim that hurricanes are increasing in frequency due to global warming? Global Warming crusaders are particularly fond of promoting the idea that we are having a profound impact on hurricane activity—they seem to never let an event go unclaimed. AtWorld Climate Report(WCR) have reviewed dozens of papers from the leading scientific journals presenting scant evidence to support a strong link between global warming and hurricane activity, and we hope you never get bored with these essays.
Wang et al. begin their article “climate control of the global tropical storm days (1965–2008”).Geophysical Research Letters, 37, analyses the impact of the rising sea surface temperature (SST) on tropical cyclone (TC) activity is one of the great societal and scientific concerns. With the observed warming of the tropics of around 0.5°C over the past 4 to 5 decades, detecting the observed change in the TC activity may shed light on the impact of the global warming on TC activity. Recent studies of the trends in the existing records of hurricane intensity have resulted in a vigorous debate in academic circlesThere no increasing trends of hurricane/TC’s in any of the world’s ocean basins.
Time series of the total annual number of tropical storm days during each TC year for the global domain (GL), western North Pacific (WNP), North Atlantic (NAT), and SH ocean (SHO), and Indo‐Pacific Warm Pool (IPWP, 17.5°S–10°N, 70°E –140°E). The left‐hand side tick marks are for individual basins (region) and the right hand side are for the global total. The mean numbers and standard deviations, maximum, and minimum are shown in the legend (from Wang et al., 2010).
US All Category Landfalling Hurricanes (1850 – 2008) (Shows a decreasing trend). (Data Source: NOAA)
Global Tropical Storm and Hurricane Frequency (1979 – 2010) Blanksolidline: Tropical storms, Red dotted line: Hurricanes. (Source: Dr. Ryan Moe, Center for Oceanic and Atmospheric Studies, Florida State University)
It is difficult to project/predict sea level rise in response to warming climates since factors like • thermal expansion, • ocean oscillation, • spatio–temporal fluctuations, • melting of ice etc. are involved. But the IPCC has argued that sea levels could rise by an additional 1 meter by 2050 due to anthropogenic global warming.
Measurements from TOPEX and Jason series of satellite radio altimeters have allowed estimating global mean sea level. These measurements calibrated against a network of tide gauges and can now be used for analysis. Morner's new studies on Bangladesh (Morner 2010a, 2010b) and 2007a (updated 2010) investigated the difference between the IPCC models and the observational facts which is presented in Figure 2.
The pink curve, “Models,” represents the IPCC’s combination of selected tide-gauge records and corrected satellite altimetry data. The blue curve, “Observations,” represents the observed estuatic sea level changes in the field according to Mörner (1973) up to 1960 and thereafter. After 1965, the two curves start to diverge, presenting two totally different views (separated bythe area with the question mark), where only one view can be tenable.
Sea level changes for the last 400 years as based on novel morphological and stratigraphical evidence in the region of Kotka, Hiron Point and the Sibsa-Passur river-system composed of the following facts: (1) a low sea level in the 18th century recorded by the inter-clay unconformity and the findings of salt ovens, (2) a major sea level rise giving rise to the delta surface and mangrove ecosystem, (3) a sea level fall in the order of 10–20 cm as indicated by a lower present HTL, and (4) a period of stability indicated by segments of dry land, habitation, vegetation by species of low salt tolerance, progradation of coastal segments at Hiron Point and Herbaria and the stratigraphy at Kotka. This curve exhibits many similarities with the sea level curve of the Maldives (Mörner, N.-A., 2009, 2007b)
1. Some scientists believe that the above predictions are too pessimistic, and too unrealistic, because: (a) The computer predictions are based on present-day information. (b) Present-day estimates of atmospheric CO2 concentration are grossly erroneous. Some scientists suggest that such estimates may be 3-4 times higher than reality