Download
1 / 27
360 likes | 997 Vues
Climate Change—Lecture 1. The Science of Climate Change. Major Sources Congressional Budget Office (2003), “The Economics of Climate Change: A Primer ” ( http:// www.cbo.gov/ftpdocs/41xx/doc4171/04-25-ClimateChange.pdf )

E N D
Climate Change—Lecture 1 The Science of Climate Change Major Sources • Congressional Budget Office (2003), “The Economics of Climate Change: A Primer” (http://www.cbo.gov/ftpdocs/41xx/doc4171/04-25-ClimateChange.pdf) • IPCC (2007), “Climate Change 2007: Synthesis Report. Summary for Policymakers” (http://www.ipcc.ch/pdf/assessment-report/ar4/wg3/ar4-wg3-spm.pdf) The Intergovernmental Panel on Climate Change (IPCC) is the leading international body for the assessment of climate change. It was established by the United Nations Environment Programme (UNEP) and the World Meteorological Organization (WMO) in 1988 to provide the world with a clear scientific view on the current state of knowledge in climate change and its potential environmental and socio-economic impacts.
Different definitions of climate change • IPCC (International Panel on Climate Change): change in climate over time, whether due to natural variability or as a result of human activity. • UNFCCC (United Nations Framework Convention on Climate Change): change of climate that is attributed directly or indirectly to human activity that alters the composition of the global atmosphere and that is in addition to natural variability.
Climate change refers to a major alteration in a climate measure such as temperature, wind, and precipitation that is prolonged, i.e., lasting decades or longer • Global warming: sunlight hits earth’s surface, radiates back into atmosphere, where its absorption by GHGs heats atmosphere and warms earth’s surface; somewhat like a greenhouse that allows sunlight through the glass but prevents the heated air from escaping back outside, thus “greenhouse effect” ECO324-Ch13
Energy budget without greenhouse effect (Moon) Numbers in W/m2 (Watts per square meter) Source: IPCC (2001)
Natural greenhouse effect • The atmosphere contains several trace gases which absorb and emit infrared radiation. These so-called greenhouse gases absorb infrared radiation, emitted by the Earth’s surface, the atmosphere and clouds, except in a transparent part of the spectrum called the “atmospheric window”. They emit in turn infrared radiation in all directions including downward to the Earth’s surface. Thus greenhouse gases trap heat within the atmosphere. This mechanism is called the natural greenhouse effect. The net result is an upward transfer of infrared radiation from warmer levels near the Earth’s surface to colder levels at higher altitudes. The infrared radiation is effectively radiated back into space from an altitude with a temperature of, on average, –19°C, in balance with the incoming radiation, whereas the Earth’s surface is kept at a much higher temperature of on average 14°C. This effective emission temperature of –19°C corresponds in mid-latitudes with a height of approximately 5 km. Note that it is essential for the greenhouse effect that the temperature of the lower atmosphere is not constant but decreases with height.
Enhanced greenhouse effect • An increase in the concentration of greenhouse gases leads to an increased infrared opacity of the atmosphere, and therefore leads an effective radiation into space from a higher altitude at a lower temperature. This causes a radiative forcing that leads to an enhancement of the greenhouse effect, the so-called enhanced greenhouse effect. • An easier definition: an increase in the natural process of the greenhouse effect, brought about by human activities, whereby greenhouse gases such as carbon dioxide, methane, chlorofluorocarbons and nitrous oxide are being released into the atmosphere at a far greater rate than would occur through natural processes and thus their concentrations are increasing. Also called anthropogenic greenhouse effect.
Natural greenhouse effect makes sure earth has nice temperature: on average 14°C instead of –19°C • Enhanced greenhouse effect is anthropogenic: human-caused emissions of GHGs tips natural system out of equilibrium
The previous two tables present characteristics of major greenhouse gases. The Global Warming Potential (GWP) indicates the warming effect of a greenhouse gas, while the atmospheric lifetime expresses the total effect of a specific greenhouse gas after taking into account global sink availability. The lifetime indicates how long the gas remains in the atmosphere. The vast majority of emissions are carbon dioxide followed by methane and nitrous oxide. Lesser amounts of CFC-12, HCFC-22, Perflouroethane and Sulfur Hexaflouride are also emitted and their contribution to global warming is magnified by their high GWP, although there total contribution is still small compared to the other gasses.
Measures of climate dynamics • Global warming potential (GWP)—based on heat-absorbing ability of each gas relative to that of carbon dioxide; calculated over a specific time interval, commonly 20, 100 or 500 years; the 20 year GWP of methane is 72, which means that if the same mass of methane and carbon dioxide were introduced into the atmosphere, one unit of methane has 72 times the capacity for heat absorptions as one unit of carbon dioxide over the next 20 years • Radiative forcing (RF)—is a measure of the influence that a factor has in altering the balance of incoming and outgoing energy in the Earth-atmosphere system and is an index of the importance of the factor as a potential climate change mechanism. Positive forcing tends to warm the surface while negative forcing tends to cool it. Expressed in watts per square meter (W/m2).
The concept of RF is useful because a linear relationship has been determined between the change in global mean surface temperature (ΔT) and the change in RF since 1750 (ΔRF): ΔT=λ ΔRF • The temperature increase caused by a doubling of CO2 concentration with respect to pre-industrial 1750 is called “climate sensitivity parameter”; the IPCC (2007) estimates it to be in the range of [2°C, 4.5°C] with a best estimate of 3°C = 5.4°F • If climate sensitivity is ΔT ≈ 3°C and the forcing caused by a doubling of CO2 is ΔRF ≈ 3.7 W/m2 we find that λ = ΔT/ΔRF ≈ 0.8°C / (W/m2)
Global CO2 emissions up 3% in 2011Anne-Françoise PELE ,7/26/2012http://www.eetimes.com/electronics-news/4391238/Global-CO2-emissions-up-3--in-2011 • PARIS—After a 1% decline in 2009 and an unprecedented 5% surge in 2010, global emissions of carbon dioxide increased by 3% in 2011, to 34 billion tons, according to the annual report “Trends in global CO2 emissions” by the European Commission's Joint Research Center (JRC) and the Netherlands Environmental Assessment Agency (PBL).
The 3% increase in global CO2 emissions in 2011 is above the past decade's average annual increase of 2.7%. The top emitters contributing to the 34 billion tones of CO2 emitted globally in 2011 are: China (29%), the United States (16%), the European Union (11%), India (6%), the Russian Federation (5%) and Japan (4%).
CO2 emissions per country from fossil fuel use and cement production
CO2 emissions per country from fossil fuel use and cement production
Andrew LeDnne, November 1, 2011 https://sge.lclark.edu/2011/11/01/comparing-per-capita-gdp-vs-per-capita-co2-emissions/
After CO2 emissions are reduced and atmospheric concentrations stabilize, surface air temperature continues to rise slowly for a century or more. Thermal expansion of the ocean continues long after CO2 emissions have been reduced, and melting of ice sheets continues to contribute to sea-level rise for many centuries. This figure is a generic illustration for stabilization at any level between 450 and 1,000 ppm, and therefore has no units on the response axis. Responses to stabilization trajectories in this range show broadly similar time courses, but the impacts become progressively larger at higher concentrations of CO2.
Climate change indicators (I) We do observe that warmer climate was usually associated with higher atmospheric concentrations of greenhouse gases; methane has similar pattern.
How do they actually get temperatures hundreds of thousands years back ?! • Drilling deep, deep holes into glaciers and polar ice and analyzing tiny air bubbles for isotopes whose composition reflects the temperature as it prevailed on the surface when they were trapped. • These air bubbles also indicate the CO2 concentration at that time!
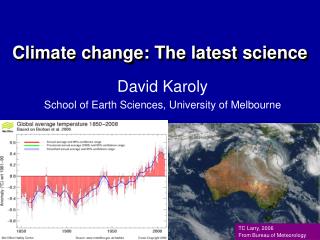
The figure shows the combined land-surface air and sea surface temperatures (degrees Centigrade) from 1861 to 1998, relative to the average temperature between 1961 and 1990. • The mean global surface temperature has increased by about 0.3 to 0.6°C since the late 19th century and by about 0.2 to 0.3°C over the last 40 years, which is the period with most reliable data. Recent years have been among the warmest since 1860 - the period for which instrumental records are available.
Climate change indicators (II) Source: IPCC (2007) “Warming of the climate system is unequivocal, as is now evident from observations of increases in global average air and ocean temperatures, widespread melting of snow and ice, and rising global average sea level”
Causes of climate change • “Global GHG emissions due to human activities have grown since pre-industrial times, with an increase of 70% between 1970 and 2004.” • “Most of the observed increase in global average temperatures since the mid-20th century is very likely due to the observed increase in anthropogenic GHG concentrations. It is likely that there has been significant anthropogenic warming over the past 50 years averaged over each continent (except Antarctica).” • “The observed widespread warming of the atmosphere and ocean, together with ice mass loss, support the conclusion that it is extremely unlikely that global climate change of the past fifty years can be explained without external forcing, and very likely that it is not due to known natural causes alone.” Source: IPCC (2007)
Anthropogenic climate change • “Black carbon”(smoke e.g. from diesel engines) traps all radiation passing by, thus strongly heating the lower atmosphere. • When we heat the earth, snow and ice covers may melt, decreasing the albedo, increasing the temperature. • Slightly more than half of anthropogenic greenhouse gas emissions is CO2 from fuels combustion (oil, gas, and coal) and cement production. • Substantial emissions come from land use change (cutting down forests). • Methane is a very powerful greenhouse gas (about 70 times as powerful as CO2), but depreciates faster. It’s effective life-time potential is about 20 times as high as for CO2. Rice fields and cattle are famous sources of methane emissions.