Unemployment
20. Unemployment. E conomics. E S S E N T I A L S O F. N. Gregory Mankiw. Premium PowerPoint Slides by Ron Cronovich. In this chapter, look for the answers to these questions:. How is unemployment measured? What is the “natural rate of unemployment”?


Unemployment
E N D
Presentation Transcript
20 Unemployment Economics E S S E N T I A L S O F N. Gregory Mankiw Premium PowerPoint Slides by Ron Cronovich
In this chapter, look for the answers to these questions: • How is unemployment measured? • What is the “natural rate of unemployment”? • Why are there always some people unemployed? • How is unemployment affected by unions and minimum wage laws? • What is the theory of efficiency wages, and how does it help explain unemployment? 1
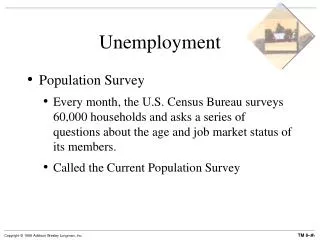
Labor Force Statistics Produced by Bureau of Labor Statistics (BLS), in the U.S. Dept. of Labor Based on regular survey of 60,000 households Based on “adult population” (16 yrs or older) 0 UNEMPLOYMENT
Labor Force Statistics BLS divides population into 3 groups: Employed: paid employees, self-employed, and unpaid workers in a family business Unemployed: people not working who have looked for work during previous 4 weeks Not in the labor force: everyone else The labor force is the total # of workers, including the employed and unemployed. 0 UNEMPLOYMENT
Labor Force Statistics = 100 x u-rate labor force # of unemployed adult population labor force = 100 x labor force participation rate 0 Unemployment rate (“u-rate”): % of the labor force that is unemployed Labor force participation rate: % of the adult population that is in the labor force UNEMPLOYMENT
A C T I V E L E A R N I N G 1Calculate labor force statistics Compute the labor force, u-rate, adult population, and labor force participation rate using this data: 5
A C T I V E L E A R N I N G 1Answers Labor force = employed + unemployed = 145.9 + 8.5 = 154.4 million U-rate = 100 x (unemployed)/(labor force) = 100 x 8.5/154.4 = 5.5% 6
A C T I V E L E A R N I N G 1Answers Population = labor force + not in labor force = 154.4 + 79.2 = 233.6 LF partic. rate = 100 x (labor force)/(population) = 100 x 154.4/233.6 = 66.1% 7
Labor Market Statistics for Different Groups The BLS publishes these statistics for demographic groups within the population. These data reveal widely different labor market experiences for different groups. 0 UNEMPLOYMENT
Labor Market Statistics for Whites & Blacks, June 2008 0 UNEMPLOYMENT
Labor Market Statistics for Whites & Blacks, June 2008 0 UNEMPLOYMENT
Labor Market Statistics for Other Groups, June 2008 0 UNEMPLOYMENT
Labor Market Statistics by Education Level, June 2008 0 UNEMPLOYMENT
LF Participation Rates by Sex, 1950-2007 0 Men Women UNEMPLOYMENT
A C T I V E L E A R N I N G 2Limitations of the u-rate In each of the following, what happens to the u-rate? Does the u-rate give an accurate impression of what’s happening in the labor market? A. Sue lost her job and begins looking for a new one. B. Jon, a steelworker who has been out of work since his mill closed last year, becomes discouraged and gives up looking for work. C. Sam, the sole earner in his family of 5, just lost his $80,000 job as a research scientist. Immediately, he takes a part-time job at McDonald’s until he can find another job in his field. 14
A C T I V E L E A R N I N G 2Answers A. Sue lost her job and begins looking for a new one. u-rate rises A rising u-rate gives the impression that the labor market is worsening, and it is. 15
A C T I V E L E A R N I N G 2Answers B. Jon has been out of work since last year, becomes discouraged, stops looking for work. Discouraged workers • would like to work but have given up looking for jobs • classified as “not in the labor force” rather than “unemployed” U-rate falls because Jon is no longer counted as unemployed. A falling u-rate gives the impression that the labor market is improving, but it is not. 16
A C T I V E L E A R N I N G 2Answers C. Sam lost his $80,000 job, and takes a part-time job at McDonald’s until he finds a better one. U-rate unchanged because a person is “employed” whether they work full or part time. Things are worse, but the u-rate fails to show it. 17
What Does the U-Rate Really Measure? The u-rate is not a perfect indicator of joblessness or the health of the labor market: It excludes discouraged workers. It does not distinguish between full-time and part-time work, or people working part time because full-time jobs not available. Some people misreport their work status in the BLS survey. Despite these issues, the u-rate is still a very useful barometer of the labor market & economy. 0 UNEMPLOYMENT
The Duration of Unemployment Most spells of unemployment are short: Typically 1/3 of the unemployed have been unemployed under 5 weeks, 2/3 have been unemployed under 14 weeks. Only 20% have been unemployed over 6 months. Yet, most observed unemployment is long term. The small group of long-term unemployed persons has fairly little turnover, so it accounts for most of the unemployment observed over time. Knowing these facts helps policymakers design better policies to help the unemployed. 0 UNEMPLOYMENT
Cyclical Unemployment vs. the Natural Rate There’s always some unemployment, though the u-rate fluctuates from year to year. Natural rate of unemployment the normal rate of unemployment around which the actual unemployment rate fluctuates Cyclical unemployment the deviation of unemployment from its natural rate associated with business cycles, which we’ll study in later chapters 0 UNEMPLOYMENT
U.S. Unemployment, 1960-2007 12 Unemployment rate 10 8 6 Natural rate of unemployment 4 2 0 1960 1965 1970 1975 1980 1985 1990 1995 2000 2005 0 percentage of labor force
Explaining the Natural Rate: An Overview Even when the economy is doing well, there is always some unemployment, including: Frictional unemployment occurs when workers spend time searching for the jobs that best suit their skills and tastes short-term for most workers Structural unemployment occurs when there are fewer jobs than workers usually longer-term 0 UNEMPLOYMENT
A C T I V E L E A R N I N G 3Applying the concepts Which of the following would be most likely to reduce frictional unemployment? A. The govt eliminates the minimum wage. B. The govt increases unemployment insurance benefits. C. A new law bans labor unions. D. More workers post their resumes at Monster.com, and more employers use Monster.com to find suitable workers to hire. E. Sectoral shifts become more frequent. 23
A C T I V E L E A R N I N G 3Answers Which of the following would be most likely to reduce frictional unemployment? A. The govt eliminates the minimum wage. C. A new law bans labor unions. These are likely to reduce structural unemployment, not frictional unemployment. 24
A C T I V E L E A R N I N G 3Answers Which of the following would be most likely to reduce frictional unemployment? B. The govt increases unemployment insurance benefits. E. Sectoral shifts become more frequent. These are likely to increasefrictional unemployment, not reduce it. 25
A C T I V E L E A R N I N G 3Answers Which of the following would be most likely to reduce frictional unemployment? D. More workers post their resumes at Monster.com, and more employers use Monster.com to find suitable workers to hire. Likely to speed up the process of matching workers & jobs, which would reduce frictional unemployment. 26
CHAPTER SUMMARY • The unemployment rate is the percentage of those who would like to work who do not have jobs. • Unemployment and labor force participation vary widely across demographic groups. • The natural rate of unemployment is the normal rate of unemployment around which the actual rate fluctuates. Cyclical unemployment is the deviation of unemployment from its natural rate and is connected to short-term economic fluctuations. 27
CHAPTER SUMMARY • The natural rate includes frictional unemployment and structural unemployment. • Frictional unemployment occurs when workers take time to search for the right jobs. • Structural unemployment occurs when above- equilibrium wages result in a surplus of labor. • Three reasons for above-equilibrium wages include minimum wage laws, unions, and efficiency wages. 28