Download
1 / 48
480 likes | 667 Vues
Sequence Alignment Biomedische Wetenschappen BW204 2011 Han Rauwerda Martijs Jonker Microarray Department UvA / Integrative Bioinformatics Unit (MAD/IBU). Introduction. 2003: 30364 articles. 2011: 60141 articles. Databases: Genbank, EMBL: DNA SWISS-PROT, PIT PRF : protein KEGG Genes: genes

E N D
Sequence AlignmentBiomedische WetenschappenBW2042011Han RauwerdaMartijs JonkerMicroarray Department UvA / Integrative Bioinformatics Unit (MAD/IBU)
Introduction 2003: 30364 articles 2011: 60141articles Databases: Genbank, EMBL: DNA SWISS-PROT, PIT PRF : protein KEGG Genes: genes PDB: protein structure mind the scale on the Y-axis. 29777 articles in ~ 8 years, 3722 articles per year, > 10 articles per day http://www.genome.jp/en/db_growth.html
Data, Information & Knowledge William Harvey: bloedsomloop (1628) De anatomische les van Dr. Nicolaes Tulp(Rembrandt) Teatro Anatomico di Padova (1594) Data verzamelen Categoriseren van data: informatie Experimenten, theorie vorming uit informatie
Data, Information & Knowledge Darwin spotlijsters op Galapagos (1835) Linnaeus 1756 Categoriseren van data: informatie Experimenten, theorie vorming uit informatie Data verzamelen
Data, Information & Knowledge Informatie en theorie vorming: visualisatie • John Snow’s cholera map of September 1854 Dots are deaths by cholera, crosses are water pumps • Florence Nightingale Polar Diagrams Crimean War (1855) Crimean War, half a million deaths
Data, Information & Knowledge Informatie en theorie vorming: computationele methoden Biologist, “Founder of Modern Statistical Science” • Analysis of Variance • Fisher's exact test • Fisher's z-distribution • …….. • Ronald Fisher (1890-1962) • Rothamsted, Harpenden UK
Data, Information & Knowledge In Genomics: Sanger Sequencers e.g. tyrosine kinase inhibitors in cancer therapy Sequence Databases Experimenten, theorie vorming uit informatie Categoriseren van data genereert informatie Data genereren
Biological Databases • Scientific method has not changed: • Formulate a hypothesis • Perform Experiment • Test hypothesis • reject or not reject • Add new insights to theory • What has changed in biology: • amount of data • dynamics of data • how scientists access & share data, information and knowledge • how scientists use data, information and knowledge. • downloads, ‘freezes’ • High Performance Computing (Cloud, grid, Web services)
Biological Databases • Basic sequence data • Curated sequence data (information) • Organism specific databases, e.g. • Flybase • Wormbase • TAIR • Topical databases e.g. • literature • diseases • experiments • Portals e.g. • Entrez • Ensembl
Biological Databases • How reliable are Biological Databases? • errors, unknown reliability • redundancy • repeated submission • different sequences with the same name (e.g. ey) • erroneous annotations • identical sequences with more than one name“Biologists would rather share their toothbrush than share a gene name” • amplification of errors:each new entry based on erratic information amplifies that error. • Example: contamination of cell lines by HeLa Cell lines(sometimes referred to as a persistent laboratory "weed“): • “ As journals wrestle with the problems posed by cell line mix-ups—Reynolds goes so far as to estimate that journals would have to retract 35% to 40% of their previously published cell biology papers to weed out invalid data …. “ • Chatterjee R. Cell biology. Cases of mistaken identity. Science. 2007 Feb 16;315(5814):928-31
Example: p53 in Entrez Gene: >gi|189083686|ref|NP_112251.2| cellular tumor antigen p53 [Rattus norvegicus] MEDSQSDMSIELPLSQETFSCLWKLLPPDDILPTTATGSPNSMEDLFLPQDVAELLEGPEEALQVSAPAAQEPGTEAPAPVAPASATPWPLSSSVPSQKTYQGNYGFHLGFLQSGTAKSVMCTYSISLNKLFCQLAKTCPVQLWVTSTPPPGTRVRAMAIYKKSQHMTEVVRRCPHHERCSDGDGLAPPQHLIRVEGNPYAEYLDDRQTFRHSVVVPYEPPEVGSDYTTIHYKYMCNSSCMGGMNRRPILTIITLEDSSGNLLGRDSFEVRVCACPGRDRRTEEENFRKKEEHCPELPPGSAKRALPTSTSSSPQQKKKPLDGEYFTLKIRGRERFEMFRELNEALELKDARAAEESGDSRAHSSYPKTKKGQSTSRHKKPMIKKVGPDSD + >gi|120407068|ref|NP_000537.3| cellular tumor antigen p53 isoform a [Homo sapiens] MEEPQSDPSVEPPLSQETFSDLWKLLPENNVLSPLPSQAMDDLMLSPDDIEQWFTEDPGPDEAPRMPEAAPPVAPAPAAPTPAAPAPAPSWPLSSSVPSQKTYQGSYGFRLGFLHSGTAKSVTCTYSPALNKMFCQLAKTCPVQLWVDSTPPPGTRVRAMAIYKQSQHMTEVVRRCPHHERCSDSDGLAPPQHLIRVEGNLRVEYLDDRNTFRHSVVVPYEPPEVGSDCTTIHYNYMCNSSCMGGMNRRPILTIITLEDSSGNLLGRNSFEVRVCACPGRDRRTEEENLRKKGEPHHELPPGSTKRALPNNTSSSPQPKKKPLDGEYFTLQIRGRERFEMFRELNEALEKDAQAGKEPGGSRAHSSHLKSKKGQSTSRHKKLMFKTEGPDSD • These sequences apparently are similar but not identical….. • How do we know if stretches are similar • How do we map sequences of unequal length onto each other • Is it possible to associate a confidence level to the alignment of two sequences
Visual approach: dot matrix method (1) • Make a matrix and draw dots • Suppose sequence ACGGGAACG has mutated by an insertion of 3 As: ACGAAAGGAACG, align: • Diagonals show alignments • Image is very noisy: draw lines with an alignment of 3 or more:~ choose a window size of 3 or more. • Insertion: horizontal spacing
Dot matrix method (2) Suppose the same sequence mutated and the 10th A has become a G: • sequence 1: ACGGGAACG sequence 2: ACGAAAGGAACG → ACGAAAGGAGCG: • Window size of 3: we miss the homology in the distal part • Apply a window size of 4 and draw a line if the sum of the matches is at least 3 • What do you think?Sensitivity? Specificity?
Dot matrix method (3) • Convenient to quickly discover similarities • Does not provide confidence metric • not 1 optimal alignment • Repetitive stretches quickly recognized rat vs human p53 with dottup:
Sequence Alignment (1) • How to find the best alignment out of many possible alignments? • Scoring: reward matches, penalize mismatches and deletions • Can we motivate our choice with biological arguments? • Must have all mismatches equal penalty? • How to penalize deletions? • Take the entire alignment or just focus on stretches? • Comparison of human vs. rat P53 (stretches of similar length) • Comparison of one human P53 exon with rat chromosome 1? • Statistical metric • What is the likelihood that we would produce such an alignment by chance?
Alignment Scoring: substitution matrices (1) AC---CGAGGAACG || || ||| || ACGTTCG-GGAGCG • Which alignment is the best? • We need a scoring system: • Each element i of the alignment with length c adds to the score. The value of each element is determined by a function σ of match, mismatch and gap.A higher score ~ better alignment • Matches, mismatch and gaps contribute according to a schema (called the substitution matrix). • A simple schema for nucleotides (= Substitution Matrix): A C G T -A 1 -1 -1 -1 -1 C -1 1 -1 -1 -1 G -1 -1 1 -1 -1 T -1 -1 -1 1 -1 - -1 -1 -1 -1 • Score for the alignment AC---CGAGGAACG || || ||| || ACGTTCG-GGAGCG 2-3+2-1+3-1+2=4
Biological motivation on scoring alignments • Similarity of sequences can arise because they share a common ancestor • Homology is an evolutionary concept: Homologuous sequences are sequences that share a common ancestor. • So homologues may have a similarity of 80% or 90%, but the fact of sharing a common ancestor is boolean (true or false). • Similar sequences do not per se be related. • Molecular evolution: substitution and insertions and deletions (indels). • Two types of homology: • Orthologuous genes: related genes after speciation • Paralogous genes: related genes after gene duplications (within species) → gene families • Domains: stretches in the sequence that ‘do the job’ • highly conserved
Alignment Scoring: substitution matrices (2) AC---CGAGGAACG || || ||| || ACGTTCG-GGAGCG Nucleotides: • Should replacement of one mismatching nucleotide with another be penalized differently? • Much used: NUC2.2: • Should the starting of a gap be penalized differently from extension of a gap? • gap start: -12, gap extension -6 • Score M of alignment: • M = 2*5 -12 + (2*-6) + 2*5 -12 + 3*5 -4+2*5 = 5 A T G C A 5 -4 -4 -4 T -4 5 -4 -4 G -4 -4 5 -4 C -4 -4 -4 5
Alignment Scoring: substitution matrices (3) • Do these alignments have an equal probabilty of occurring? Each letter stands for an amino acid in this artificial sequence. • Alanine to Isoleucine: both hydrophobic • Glycine to Cysteine: both hydrophobicCysteine has a sulfhydryl group (essentialin metal binding): Gain of function • Glutamate (E), polar and non-hydrophobic and negatively charged to Isoleucine • L A S V E G A S • | | | | | | | • L A S V E G I S • L A S V E G A S • | | | | | | | • L A S V E C A S • L A S V E G A S • | | | | | | | • L A S V I G A S
Amino Acid Substitution Matrices • determine penalties and rewards in matrices by • Theoretical approach based on : • amino acid physico chemical properties • the redundancy in genetic code • Emperical / evolution motivated models • PAM matrices (Dayhoff, 1984) • based on predictions of mutations when proteins diverge from common ancestor • explicit evolutionary model • BLOSUM matrices (Henikoff & Henikoff,1992) • BLOSUM based on common regions (BLOCKS) in protein families • Matrix represented as log odds: • log ratio of observed mutation frequency and mutation frequency by chance. • Positive values: substitutions that occur more frequently than expected • Negative values: substitutions that occur less frequently than expected
Amino Acid Substitution matrices (2) • PAM (Point Accepted Mutation ~ Accepted point mutation) • Based on closely related protein sequences (85% identical) • Construct a phylogenetic tree of a sequence group. • Count the number of substitutions along each branch in time. • Take a set, 1 PAM apart (= 1% of the amino acid content has changed) • Calculate the log odds score: log10 value of the observed mutation frequency with respect to the common ancestor and the probability of that mutation by chance (1/20). This results in the PAM1 substitution matrix. • Extrapolate to matrices that are further apart, e.g. :PAM250: 250 mutations per 100 residues ~ 20% sequence identity ~ 2500 million years of evolution. • For very related sequences take a low PAM number, for very unrelated, take a high PAM number. • matrices given in log2 odds
Amino Acid Substitution matrices (3) • BLOSUM (BLOcks amino acid SUbstitution Matrices) • Basis is > 2000 conserved amino acid patterns in 500 groups of protein sequences. • Blocks: ungapped alignments of less than 60 amino acids. • BLOSUM62: sequences are taken that share on average an identity of 62% • matrices given in log10 odds • Procedure to calculate log odds score (the elements in the substitution matrix) comparable to PAM (but log2 instead of log10 values) • better suited than PAM for finding conserved domains • Much larger data set used than for the PAM matrix
Sequence Alignment (2) • Take the entire alignment or just focus on stretches? • Comparison of human vs. rat P53 (stretches of similar length) • Global Alignment • Comparison of one human P53 exon with rat chromosome 1? • Local Alignment • Global versus Local Alignment: V I V A L A S V E G A S | | | | | | | V I V A D A - V - - I S Q U E V I V A L A S V E G A S | | | | | V I V A D A V I S Global alignment of ‘VIVALASVEGAS’ and ‘VIVADAVIS’ Local alignment of ‘QUEVIVALASVEGAS’ and ‘VIVADAVIS’ (high gap penalty)
Global Alignment (1) T s t Global alignment of ‘VIVALASVEGAS’ and ‘VIVADAVIS’ V I V A L A S V E G A S | | | | | | | V I V A D A - V - - I S • A global alignment of two sequences, s and t, is an assignment of gap symbols “-” into those sequences, or at their ends. The optimal global alignment is given, so as to maximize the alignment score. • What is the longest possible alignment of two sequences s and t? And the shortest? A B C D E F G H - - - - - - - - - - - - - I J K L M
Local Alignment (1) s t Q U E V I V A L A S V E G A S prefix removed || | | | suffix removed VI V A D A V I S • Definition: A local alignment of two sequences, s and t, is a global alignment of the subsequences si:j and tk:l, for some choice (i,j) and (k,l). The optimal local alignment is given by the optimal choice of (i,j) and (k, l), so as to maximize the alignment score. Local alignment of ‘QUEVIVALASVEGAS’ on ‘VIVADAVIS’
Dynamic programming (1) T • How to optimize the alignment score? • Brute force: try all possible combinations.For a group of k objects which are a subset of a group of n, the number of possible combinations (without counting the number of k! permutations) is :Aligning two sequences of 500 bp (k=500, n=1000): 2.702882e+299 possibilities. This is impossible, and a whole genome may be in the order of Gbases!!! • Needleman & Wunsch (1970) introduced an elegant solution: • Exact (finding of the perfect alignment is garantueed) • Like the dot matrix method works with a matrix but more quantitative. • Moderate computational expense (n*m, size of matrix) • using Dynamic Programming (DP): partition a problem by overlapping subproblems followed by finding the best path.
Needleman Wunsch algorithm • At any position in the alignment, 2 options • Gap • Match or mismatch • Example: Obvious alignment Matrix form: Formula: • Calculate for each position in the matrix the most cost-effective combination and remember this decision • After calculation of the entire matrix, trace-back the most optimal alignment - B B A - A X B X B X - B B A | | A B B - σ(si,tj) is the cost of aligning s and t on the ith and jth position
Needleman Wunsch algorithm (2) Example: scoring matrix is:A B -A 1 -1 -1B -1 1 -1- -1 -1 start with the s + t length all-gapped alignment using the substitution matrix: blue digits (all gaps would mean a score of -3 + (-3) = -6 - B B A - 0 -1 -2 -3 A -1 B -2 B -3
Needleman Wunsch algorithm (2) Example: scoring matrix is:A B -A 1 -1 -1B -1 1 -1- -1 -1 start with the s + t length all-gapped alignment using the substitution matrix: blue digits (all gaps would mean a score of -3 + (-3) = -6 Proceed in the most upper left corner and determine wheter a gap, mismatch or match would result in the highest scoreA diagonal arrow is a match or a mismatch, a horizontal or vertical arrow is a gap. - B B A - 0 -1 -2 -3 A -1 -1 B -2 B -3
Needleman Wunsch algorithm (2) Example: scoring matrix is:A B -A 1 -1 -1B -1 1 -1- -1 -1 start with the s + t length all-gapped alignment using the substitution matrix: blue digits (all gaps would mean a score of -3 + (-3) = -6 Proceed in the most upper left corner and determine wheter a gap, mismatch or match would result in the highest scoreA diagonal arrow is a match or a mismatch, a horizontal or vertical arrow is a gap. Proceed with filling in the entire column (there should be digits above and to the left of each empty cell) - B B A - 0 -1 -2 -3 A -1 -1 B -2 0 B -3 -1
Needleman Wunsch algorithm (2) Example: scoring matrix is:A B -A 1 -1 -1B -1 1 -1- -1 -1 start with the s + t length all-gapped alignment using the substitution matrix: blue digits (all gaps would mean a score of -3 + (-3) = -6 Proceed in the most upper left corner and determine wheter a gap, mismatch or match would result in the highest scoreA diagonal arrow is a match or a mismatch, a horizontal or vertical arrow is a gap. Proceed with filling in the entire column (there should be digits above and to the left of each empty cell) and fill all other columns - B B A - 0 -1-2 -3 A -1 -1 -2 -1 B -2 0 0 -1 B -3 -1 1 0
Needleman Wunsch algorithm (2) Example: scoring matrix is:A B -A 1 -1 -1B -1 1 -1- -1 -1 start with the s + t length all-gapped alignment using the substitution matrix: blue digits (all gaps would mean a score of -3 + (-3) = -6 Proceed in the most upper left corner and determine wheter a gap, mismatch or match would result in the highest scoreA diagonal arrow is a match or a mismatch, a horizontal or vertical arrow is a gap. Proceed with filling in the entire column (there should be digits above and to the left of each empty cell) and fill all other columns Start from the most bottom right cell (this is the alignment score) and trace back. This produces the alignment:- B B AA B B - - B B A - 0 -1-2 -3 A -1-1 -2 -1 B -2 0 0 -1 B -3 -1 10
Smith Waterman algorithm Q U E V I V A L A S V E G A S prefix removed | | | | | suffix removed VI V A D A V I S Formula: • Very similar to Needleman-Wunsch, but (changes in blue) • Initialize with zeros • Calculate for each position in the matrix the most cost-effective combination and remember this decision. Replace negative values with zeros. • After calculation of the entire matrix, trace-back the most optimal alignment, starting with the element with the higest score Local alignment of ‘QUEVIVALASVEGAS’ on ‘VIVADAVIS’
Statistical analysis of alignments • What would be the H0? • H0: the similarity between two sequences occurs by chance (or: the sequences are unrelated) • Must we reject the null hypothesis? • Determine the probability of the null hypothesis • What is the distribution of the nucleotides, amino acids? • Probably not normally distributed! • Multinomial sequence model. For nucleotides: p = (pA, pC, pG, pT) • Markov models: takes short distance dependencies on the sequence into account. • e.g. occurances of CG tend to have higher CG content in their vicinity • Models that take knowledge into account (e.g. for nucleotide sequences that are thought to be protein coding, use the genetic code as blocks)
Statistical analysis of alignments (2) • Approach: • Construct a distribution by a method of choiceExample (multinomial model): • Permute n times a sequence that reflects the actual distribution of nucleotides or amino acids in the population • Calculate the alignment for each permutated sequence • Determine which fraction has an equal or higher score than the original alignment. • If n is large and the sequence is not very short (#permutations depends on sequence_length) this can be interpreted as a p-value. • Example: • original score ~ 2 • sequence length = 12 (12! ~ 479,001,600 permutations possible) • 2000 permutations • 5 permutated sequences have a score in (2,2,3,3,4). • p-value = 5/2000 = 0.0025
Sequence Alignment Now we know • what type of alignment to use (global or local) • how to score an alignment • how to discover the optimal alignment • how to attach a confidence level to an alignment
BLAST (1) • With statistics: check 1 alignment implicates making 1001 or more alignments. • Often: question = can we find any domains, boxes, similarity of a sequence of interest against all known sequences of a species or a number of species. • Instead 1 alignment, make thousands of alignments • Database searching • Smith-Waterman too slow. • Basic Local Alignment Search Tool: BLAST • Heuristics: ‘rule of thumb’, common sense, used to rapidly come to a solution that is reasonably close to the best possible answer. • Reduce search space • BLAST: approx. 50 - 100 times faster than dynamic programming
BLAST (2) Steps: • Create all possible words from the query sequence (default: proteins 3, nucleotides 11) • E.g. VIVADAVIS: VIV,IVA,VAD,ADA,DAV,AVI,VIS • It may be that in the query sequence also words are occuring more than once. • Seeding step: seek words of length W (3 for proteins, 11 for nucl.) that score at least T when aligned with the query (scored with a chosen substitution matrix). This is the step that reduces the search space considerably. • More in detail: 20^3 possible match scores for a protein, 4^11 possible 11mers. Set a threshold T and by using an appropriate similarity matrix, only take into account words that have a score greater than T. • Extend the alignment as long as it increases. The resulting stretches of aligned query and database sequence are called High Scoring Pairs (HSP). • More in detail: this always would produce a non-gapped alignment. Nowadays HSPs that are in the same region are subjected to dynamic programming to produce a gapped alignment.
BLAST (3) Example BLAST output (NCBI):
BLAST (4) Input = nucleotide translated to 6 proteins; Blasted against protein database Input = nucleotide translated to 6 protein stretches; Blasted against 6 protein databases constructed from a nucleotide database Input = protein translated to 6 nucleotide stretches;Blasted against nucleotide database Flavors of BLAST: • If you know a nucleotide sequence is protein coding, BLASTX will increase the sensitivity of the search. • TBLASTX: search for distant relatedness.
Statistical analysis of alignments (3) • BLAST: align against many sequences: adapt statistical metrics • It makes a difference if we search for an alignment in a database 5 sequences or in a database of 1,000,000 sequences. • Question is: Given the size of the database what is the likelihood that a resulting alignment is caused by random chance? • Expect value (or e-value): m ~ number of residues in database n ~ number of residues in query K and lambda~ parameters; S ~ score • What does an e-value of 1 mean? Is there a maximum e-value? • e-value dependant on size of the database: • suppose your database grows because of your new sequences apparatus, your e-values will change • bit score: score of the alignment normalized for the substitution matrix. • Use the bitscore when you want to compare BLAST results from different databases.
Blast(5) formal definitions • In the limit of sufficiently large sequence lengths m and n, the statistics of HSP scores are characterized by two parameters, K and lambda. Most simply, the expected number of HSPs with score at least S is given by the formulaWe call this the E-value for the score S. The parameters K and lambda can be thought of simply as natural scales for the search space size and the scoring system respectively • By normalizing a raw score using the formulaone attains a "bit score" S', which has a standard set of units. • Rewritten: • The chance of finding zero HSPs with score >=S is e-E, so the probability of finding at least one such HSP is :For example, if one expects to find three HSPs with score >= S, the probability of finding at least one is 0.95. The BLAST programs report E-value rather than P-values because it is easier to understand the difference between, for example, E-value of 5 and 10 than P-values of 0.993 and 0.99995. However, when E < 0.01, P-values and E-value are nearly identical.
Remarks on database alignment • Most programs offer possibility to mask Low Complexity Regions: • Short segments of repeats • Segments with a small number of residues • Programs like BLAST: • FASTA: • uses shorter words (ktuples ~ words) • approx. the same speed as BLAST • BLAT: Blast Like Alignment Tool • makes an index of all non-overlapping kmers and stores this in memory. • Much faster than BLAST • very ubiquitous stretches are not found because BLAT stores only unique or relatively rare fragments in its index. • Today: many new aligners appear to facilitate short read alignment from Next Generation Sequence data.
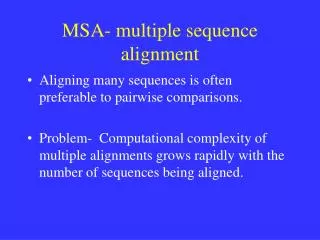
Multiple Sequence Alignment • Question: how related is a set of sequences from human, mouse and cow that are thought to represent similar domains? Which ones are most similar? • Definition: a multiple (global) alignment of k sequences is an assignment of gap symbols into those sequences or at their ends. The k resulting strings are placed one above the other to maximize the score of the entire alignment. • How to design the algorithm • How to formulate the scoring system. • Algorithm: cost of extending dynamic programming: n*m*k • number of heuristic approaches • cluster sequences, start with pairwise alignment of most similar two and extend the alignment with stepwise less similar sequences (greedy algorithms). • Scoring: sum of pairs • Calculate the score, using an appropriate substitution matrix, of each pair of alignments (example: k=4, number of pairs = )
The Practical • This afternoon: • Assignment 1, 2, 3c, 3d, 4 en 5d • Assignment 1d: kies als E-value bijv. 1 • hogere E-values geven zeer veel resultaten terug waardoor het lastig wordt de set te analyseren. • Assignment 5d: • Een PSSM is een Position Specific Scoring Matrix. Het is een matrix die een motief van een bepaalde lengte beschrijft en per positie de relatieve frequentie van een nucleotide of aminozuur weergeeft. • Een PSSM is dus een manier omeen gedegenereerde sequentiekwantitatief te bekijken, bijvoorbeeld: