
Uploaded by
amiel
1 SLIDES
93 VUES
10LIKES
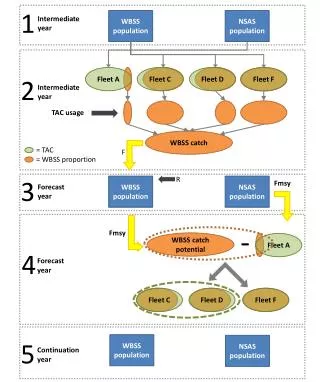
Sustainable Management Strategies for Fisheries Population Control
DESCRIPTION
This study investigates the population control strategies of Fisheries Fleets A, C, D, and F in relation to WBSS and NSAS populations. It examines TAC usage, catch potential, and Fmsy forecasts to determine sustainable management practices.
Download
1 / 1
Télécharger la présentation 
Sustainable Management Strategies for Fisheries Population Control
An Image/Link below is provided (as is) to download presentation
Download Policy: Content on the Website is provided to you AS IS for your information and personal use and may not be sold / licensed / shared on other websites without getting consent from its author.
Content is provided to you AS IS for your information and personal use only.
Download presentation by click this link.
While downloading, if for some reason you are not able to download a presentation, the publisher may have deleted the file from their server.
During download, if you can't get a presentation, the file might be deleted by the publisher.
E N D
Presentation Transcript
1 WBSS population NSAS population Intermediate year Fleet A Fleet C Fleet D Fleet F 2 Intermediate year TAC usage = TAC = WBSS proportion WBSS catch F 3 R WBSS population NSAS population Fmsy Forecast year - Fmsy WBSS catch potential Fleet A 4 Forecast year Fleet D Fleet F Fleet C WBSS population 5 NSAS population Continuation year


More Related