Download
1 / 48
480 likes | 714 Vues
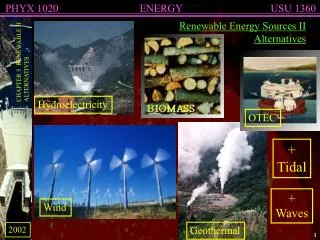
Renewable Energy Sources II: Alternatives Part I. Lecture #10 HNRS 228 Energy and the Environment. Chapter 5 Summary. Hydroelectric Power Wind Power Ocean Thermal Energy Conversion Biomass as Energy Geothermal Energy Tidal Energy Wave Energy Today’s Focus Hydroelectric Power

E N D
Renewable Energy Sources II: Alternatives Part I Lecture #10 HNRS 228 Energy and the Environment
Chapter 5 Summary • Hydroelectric Power • Wind Power • Ocean Thermal Energy Conversion • Biomass as Energy • Geothermal Energy • Tidal Energy • Wave Energy • Today’s Focus • Hydroelectric Power • Wind Power
iClicker Question • What is the definition of insolation? • A The effective solar insulation factor. • B The amount of light received by a horizontal surface averaged over the year. • C The amount of light received by a unit area of the atmosphere averaged over the year. • D There is none, it is a mis-spelling of insulation. • E The amount of insulation that is received from the Sun.
iClicker Question • What is the definition of insolation? • A The effective solar insulation factor. • B The amount of light received by a horizontal surface averaged over the year. • C The amount of light received by a unit area of the atmosphere averaged over the year. • D There is none, it is a mis-spelling of insulation. • E The amount of insulation that is received from the Sun.
iClicker Question • Roughly what percentage of light from the Sun reaches the ground? • A 10% • B 20% • C 30% • D 40% • E 50%
iClicker Question • Roughly what percentage of light from the Sun reaches the ground? • A 10% • B 20% • C 30% • D 40% • E 50%
iClicker Question • What is roughly the maximum efficiency for a photovoltaic cell? • A 10% • B 15% • C 30% • D 40% • E 50%
iClicker Question • What is roughly the maximum efficiency for a photovoltaic cell? • A 10% • B 15% • C 30% • D 40% • E 50%
iClicker Question • How much energy does the largest photovoltaic system produce? • A 10 MW • B 20 MW • C 60 MW • D 100 MW • E 200 MW
iClicker Question • How much energy does the largest photovoltaic system produce? • A 10 MW • B 20 MW • C 60 MW • D 100 MW • E 200 MW
iClicker Question • What must be done to overcome the setting of the Sun in a solar energy system? • A Store energy in batteries. • B Get electrical power from elsewhere. • C Don’t use electrical power at night. • D All of the above are alternative approaches for energy after sunset.
iClicker Question • What must be done to overcome the setting of the Sun in a solar energy system? • A Store energy in batteries. • B Get electrical power from elsewhere. • C Don’t use electrical power at night. • D All of the above are alternative approaches for energy after sunset.
iClicker Question • Based upon the discussion of the glass in a flat plate collector, how would you define the greenhouse gas effect? • A An effect caused by a gas that is transparent to visible light and opaque to infrared radiation. • B An effect caused by a gas that is transparent to infrared radiation and opaque to ultraviolet radiation. • C An effect caused by a gas that is transparent to ultraviolet radiation and opaque to infrared radiation. • D An effect caused by a gas that is transparent to infrared radiation and opaque to visible light. • E An effect caused by the sun emitting more infrared radiation than ultraviolet radiation.
iClicker Question • Based upon the discussion of the glass in a flat plate collector, how would you define the greenhouse gas effect? • A An effect caused by a gas that is transparent to visible light and opaque to infrared radiation. • B An effect caused by a gas that is transparent to infrared radiation and opaque to ultraviolet radiation. • C An effect caused by a gas that is transparent to ultraviolet radiation and opaque to infrared radiation. • D An effect caused by a gas that is transparent to infrared radiation and opaque to visible light. • E An effect caused by the sun emitting more infrared radiation than ultraviolet radiation.
Renewable Resources Discussed in Book • Renewable means anything that won’t be permanently destroyed by using it • sunlight (the sun will rise again tomorrow) • biomass (grows again) • hydrological cycle (will rain again) • wind (sunlight on Earth makes more) • ocean currents (driven by Sun) • tidal motion (Moon/Sun keep on producing it) • geothermal (heat sources inside Earth not used up fast)
Another look at available energy flow • The flow of radiation (solar and thermal) was covered previously • earth is in an energy balance: energy in = energy out • 30% reflected, 70% thermally re-radiated • Some of the incident energy is absorbed, but what exactly does this do? • much goes into heating the air/land • much goes into driving weather (rain, wind) • some goes into ocean currents • some goes into photosynthesis
Outstanding Points from Fig. 5.1 • Incident radiation is 1741015 W • this is 1370 W/m2 times area facing sun (R2) • 30% directly reflected back to space • off clouds, air, land • 47% goes into heating air, land, water • 23% goes into evaporating water, precipitation, etc. (part of weather) • Adds to 100%, so we’re done • but wait! there’s more…
Energy Flow, continued • 0.21% goes into wind, waves, convection, currents • note this is 100 times less than driving the water cycle • but this is the “other” aspect of weather • 0.023% is stored as chemical energy in plants via photosynthesis • total is 401012 W; half in ocean (plankton) • humans are 6 billion times 100 W = 0.61012 W • this is 1.5% of bio-energy; 0.00034% of incident power • All of this (bio-activity, wind, weather, etc.) ends up creating heat and re-radiating to space • except some small amount of storage in fossil fuels
The Hydrologic Cycle Lots of energy associated with evaporation: both mgh (4% for 10 km lift) and latent heat (96%) of water
Energetics of the hydrologic cycle • It takes energy to evaporate water: 2,444 J per gram • this is why “swamp coolers” work: evaporation pulls heat out of environment, making it feel cooler • 23% of sun’s incident energy goes into evaporation • By contrast, raising one gram of water to the top of the troposphere (10,000 m, or 33,000 ft) takes mgh = (0.001 kg)(10 m/s2)(10,000 m) = 100 J • So > 96% of the energy associated with forming clouds is the evaporation; < 4% in lifting against gravity
Let it Rain • When water condenses in clouds, it re-releases this “latent heat” • but this is re-radiated and is of no consequence to hydro-power • When it rains, the gravitational potential energy is released, mostly as kinetic energy and ultimately heat • Some tiny bit of gravitational potential energy remains, IF the rain falls on terrain (e.g., higher than sea level where it originated) • hydroelectric plants use this tiny left-over energy: it’s the energy that drives the flow of streams and rivers • damming up a river concentrates the potential energy in one location for easy exploitation
How much of the process do we get to keep? • According to Figure 5.1, 401015 W of solar power goes into evaporation • this corresponds to 1.61010 kg per second of evaporated water! • this is 3.5 mm per day off the ocean surface (replenished by rain) • The gravitational potential energy given to water vapor (mostly in clouds) in the atmosphere (per second) is then: mgh = (1.61010 kg)(10 m/s2)(2000 m) = 3.21014 J • One can calculate that we gain access to only 2.5% of the total amount (and use only 1.25%) • based on the 1.8% land area of the U.S. and the maximum potential of 147.7 GW as presented in Table 5.2
iClicker Question • With respects to energy, hydroelectric power represents • A remnant electric power from storms • B remnant water energy from chemical bonds • C remnant energy of chemical bonding • D remnant gravitational potential energy of precipitation • E a form of fictitious energy
iClicker Question • With respects to energy, hydroelectric power represents • A remnant electric power from storms • B remnant water energy from chemical bonds • C remnant energy of chemical bonding • D remnant gravitational potential energy of precipitation • E a form of fictitious energy
Power of a hydroelectric dam • Most impressive is Grand Coulee, in Washington, on Columbia River • 350 feet = 107 m of “head” • > 6,000 m3/s flow rate! (Pacific Northwest gets rain!) • each cubic meter of water (1000 kg) has potential energy: mgh = (1000 kg)(10 m/s2)(110 m) = 1.1 MJ • At 6,000 m3/s, get over 6 GW of power • Large nuclear plants are usually 1–2 GW • 11 other dams in U.S. in 1–2 GW range • 74 GW total hydroelectric capacity, presently
iClicker Question • What is true about hydroelectric power generation since 1950? • A It has always increased in MW produced • B It has always decreased in MW produced • C It has increased and decreased in total MW produced, but is now at a peak • D It has both increased and decreased in total MW produced • E The percentage of electric power produced by hydroelectric plants has generally increased over time
iClicker Question • What is true about hydroelectric power generation since 1950? • A It has always increased in MW produced • B It has always decreased in MW produced • C It has increased and decreased in total MW produced, but is now at a peak • D It has both increased and decreased in total MW produced • E The percentage of electric power produced by hydroelectric plants has generally increased over time
Hydroelectricity in the future? • We’re almost tapped-out: • 50% of potential is developed • remaining potential in large number of small-scale units • Problems with dams: • silt limits lifetime to 50–200 years, after which dam is useless and in fact a potential disaster and nagging maintenance site • habitat loss for fish (salmon!), etc.; wrecks otherwise stunning landscapes (Glenn Canyon in UT) • Disasters waiting to happen: 1680 deaths in U.S. alone from 1918–1958; often upstream from major population centers
Sorry: try again… • So hydroelectricity is a nice “freebee” handed to us by nature, but it’s not enough to cover our appetite for energy • Though very efficient and seemingly environmentally friendly, dams do have their problems • This isn’t the answer to all our energy problems, though it is likely to maintain a role well into our future
The Power of Wind • We’ve talked about the kinetic energy in wind before: • a wind traveling at speed v covers v meters every second (if v is expressed in m/s) • the kinetic energy hitting a square meter is then the kinetic energy the mass of air defined by a rectangular tube • tube is one square meter by v meters, or v m3 • density of air is = 1.3 kg/m3 at sea level • mass is v kg • K.E. = ½(v)·v2 = ½v3 (per square meter) • 0.65v3 at sea level
Wind Energy proportional to cube of velocity • The book (p. 134) says power per square meter is 0.61v3, which is a more-or-less identical result • might account for average density in continental U.S. (above sea level, so air slightly less dense) • So if the wind speed doubles, the power available in the wind increases by 23 = 222 = 8 times • A wind of 10 m/s (22 mph) has a power density of 610 W/m2 • A wind of 20 m/s (44 mph) has a power density of 4,880 W/m2
Can’t get it all • A windmill can’t extract all of the kinetic energy available in the wind, because this would mean stopping the wind entirely • Stopped wind would divert oncoming wind around it, and the windmill would stop spinning • On the other hand, if you don’t slow the wind down much at all, you won’t get much energy • Theoretical maximum performance is 59% of energy extracted • corresponds to reducing velocity by 36%
Practical Efficiencies • Modern windmills attain maybe 50–70% of the theoretical maximum • 0.5–0.7 times 0.59 is 0.30–0.41, or about 30–40% • this figure is the mechanical energy extracted from the wind • Conversion from mechanical to electrical is 90% efficient • 0.9 times 0.30–0.41 is 27–37%
iClicker Question • What is about the maximum efficiency of energy generation using the wind? • A 20% • B 40% • C 60% • D 80% • E 100%
iClicker Question • What is about the maximum efficiency of energy generation using the wind? • A 20% • B 40% • C 60% • D 80% • E 100%
Typical Windmills • A typical windmill might be 15 m in diameter • 176 m2 • At 10 m/s wind, 40% efficiency, this delivers about 100 kW of power • this would be 800 kW at 20 m/s • typical windmills are rated at 50 to 600 kW • How much energy per year? • 10 m/s 610 W/m2 40% 240 W/m2 8760 hours per year 2,000 kWh per year per square meter • but wind is intermittent: real range from 100–500 kWh/m2 • corresponds to 11–57 W/m2 average available power density • Note the really high tip speeds: bird killers
Average available wind power recall that average solar insolation is about 150–250 W/m2
Comparable to solar? • These numbers are similar to solar, if not a little bigger! • Let’s go to wind! • BUT: the “per square meter” is not land area—it’s rotor area • Doesn’t pay to space windmills too closely—one robs the other of energy • Typical arrangements have rotors 10 diameters apart in direction of prevailing wind, 5 diameters apart in the cross-wind direction • works out to 1.6% “fill factor”
Current implementations • Rapidly developing resource • 1400 MW in 1989; up to 6400 MW in 2003 • but still insignificant total (compare to large dams) • cost (at 5–7¢ per kWh) is competitive • growing at 25% per year • expect to triple over next ten years • Current capacity: 11.6 GW (April 2007) • Texas: 2,768 MW (recently took lead over California!!) • California: 2,361 MW • Iowa: 936 MW • Minnesota: 895 MW • Washington: 818 MW
Flies in the Ointment • Find that only 20% of rated capacity is achieved • design for high wind, but seldom get it • Only 1.2% of electrical capacity in U.S. is now wind • total electrical capacity in U.S. is 948 GW • tripling in ten years means 3.6% • but achieving only 20% of capacity reduces substantially • If fully developed, we could generate an average power almost equal to our current electrical capacity (764 GW) • but highly variable resource, and problematic if more than 20% comes from the intermittent wind
iClicker Question • Which state generates the most amount of electricity derived from wind power? • A Virginia • B Alaska • C Montana • D California • E Texas
iClicker Question • Which state generates the most amount of electricity derived from wind power? • A Virginia • B Alaska • C Montana • D California • E Texas