Download
1 / 19
190 likes | 481 Vues
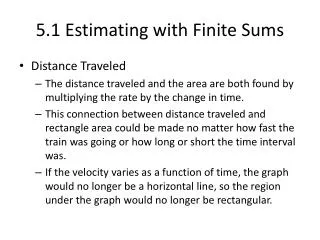
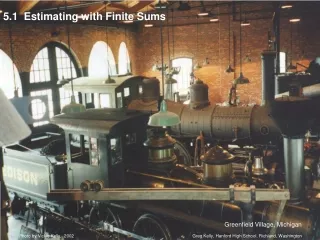
Section 4.2 Area and Estimating with Finite Sums. velocity. time. Consider an object moving at a constant rate of 3 ft/sec. Since rate . time = distance:. If we draw a graph of the velocity, the distance that the object travels is equal to the area under the line.

E N D
velocity time Consider an object moving at a constant rate of 3 ft/sec. Since rate . time = distance: If we draw a graph of the velocity, the distance that the object travels is equal to the area under the line. After 4 seconds, the object has gone 12 feet.
Consider this same object moving at a varying rate defined by the function f(x) = x Distance is still found using rate . time = distance: That means the area under the curve STILL represents the distance traveled, but since we don’t have a constant rate, how could we find that area now (after 4 seconds)? Heck – it’s a triangle! That’s easy!
What happens, though, if the velocity function is not constant, nor does it form a regular geometric shape (with an easy area formula) when we shade the area underneath it? What’s a student to do?? How can we find the area under that kind of curve?? Example:
Well … finding the area of that first rectangle was pretty easy. Why don’t we use rectangles to try and approximate the area of this unusual shape? What a brilliant idea!
Approximate area: If the velocity is not constant, we might guess that the distance traveled is still equal to the area under the curve. (The units do work out.) Example: We could estimate the area under the curve by drawing rectangles touching at their left corners. This is called the Left-hand Rectangular Approximation Method (LRAM).
Approximate area: We could also use a Right-hand Rectangular Approximation Method (RRAM).
Approximate area: Another approach would be to use rectangles that touch at the midpoint. This is the Midpoint Rectangular Approximation Method (MRAM). In this example there are four subintervals. As the number of subintervals increases, so does the accuracy.
Approximate area: The exact answer for this problem is . With 8 subintervals: width of subinterval
Using Rectangular Approximation Methodsin this example … • LRAM produced smaller than true area • RRAM produced larger than true area • MRAM produced closest to true area More Accurate = More intervals MRAM10 - means 10 slices or subintervals
RAM is used to find the area under the curve. Rectangular Approximation Methods • LRAM - • RRAM - • MRAM - Left RAM Right RAM Midpoint RAM The natural question to follow might be, “Which one should I use? It seems like the MRAM gave the best estimate, so should I always use that one?” Well … let’s see …
Let’s use f(x) = x2sinx as an example and use RAM to estimate the area under the curve from x = 0 to x = 3. As n gets increasingly larger, ALL of the approximations approach the same value! The actual area is 5.77666752.
A particle starts at x=0 and moves along the x-axis with velocity v(t)=t2 for time t >0. Where is the particle at t=3? (use 6 intervals) LRAM = y x + y x + y x +... = v t + v t + v t +... = 02(1/2) + (1/2)2(1/2) + (1)2(1/2) + (1½)2(1/2) + (2)2(1/2) + (21/2)2(1/2) = 6.875
A particle starts at x=0 and moves along the x-axis with velocity v(t)=t2 for time t >0. Where is the particle at t=3? (use 6 intervals) RRAM = y x + y x + y x +... = v t + v t + v t +... = (1/2)2(1/2) + (1)2(1/2) + (1½)2(1/2) + (2)2(1/2) + (21/2)2(1/2) + (3)2(1/2) = 11.375
A particle starts at x=0 and moves along the x-axis with velocity v(t)=t2 for time t >0. Where is the particle at t=3? (use 6 intervals) MRAM = y x + y x + y x +... = v t + v t + v t +... = (1/4)2(1/2) + (3/4)2(1/2) + (11/4)2(1/2) + (13/4)2(1/2) + (21/4)2(1/2) + (23/4)2(1/2) = 8.9375 The actual area is 9.
Area Under A Curve • The area under a curve on an interval can be approximated by summing the areas of individual rectangles on the interval. • If the rectangles are inscribed under the curve, the approximated area will be less than the desired area and the method will provide an underestimation. • If the rectangles are circumscribed above the curve, the area will be greater than the desired areaand the method will provide an overestimation.
Area Under A Curve • By using a finer partition (one with more subintervals), we make each rectangle narrower (increasing their number), and we get an area value that is closer to the true area under the curve. • By taking the limit as n (the number of rectangles) approaches infinity, the actual area is approached. Let’s look …
Let f(x) be a nonnegative, continuous function on the closed interval [a, b]. Then, the area of the region under the graph of f(x) is given by