Download

1 / 11
110 likes | 137 Vues
Learn how to estimate area under a curve using rectangular approximation methods in calculus without needing the equation. Discover Left-hand, Right-hand, and Midpoint methods for more accuracy. Find the area using inscribed and circumscribed rectangles. Use TI-89 calculator for practice.

E N D
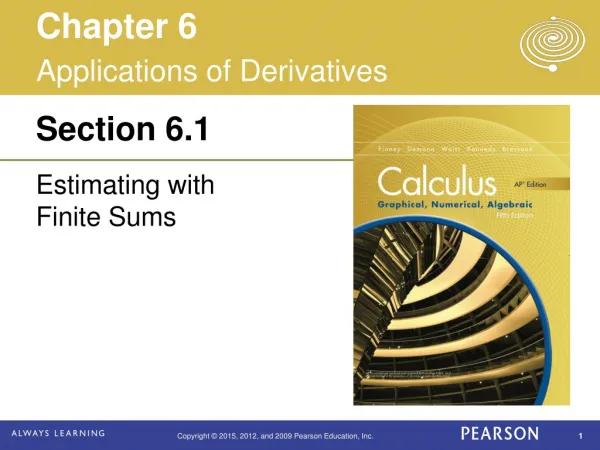
Photo by Vickie Kelly, 2002 Greg Kelly, Hanford High School, Richland, Washington 5.1 Estimating with Finite Sums Greenfield Village, Michigan
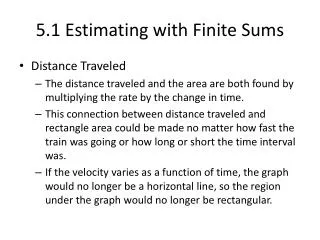
velocity time Consider an object moving at a constant rate of 3 ft/sec. Since rate . time = distance: If we draw a graph of the velocity, the distance that the object travels is equal to the area under the line. After 4 seconds, the object has gone 12 feet.
Approximate area: If the velocity is not constant, we might guess that the distance traveled is still equal to the area under the curve. (The units work out.) Example: We could estimate the area under the curve by drawing rectangles touching at their left corners. This is called the Left-hand Rectangular Approximation Method (LRAM).
Approximate area: We could also use a Right-hand Rectangular Approximation Method (RRAM).
Approximate area: Another approach would be to use rectangles that touch at the midpoint. This is the Midpoint Rectangular Approximation Method (MRAM). In this example there are four subintervals. As the number of subintervals increases, so does the accuracy.
Approximate area: The exact answer for this problem is . With 8 subintervals: width of subinterval
Circumscribed rectangles are all above the curve: Inscribed rectangles are all below the curve:
We will be learning how to find the exact area under a curve if we have the equation for the curve. Rectangular approximation methods are still useful for finding the area under a curve if we do not have the equation. The TI-89 calculator can do these rectangular approximation problems. This is of limited usefulness, since we will learn better methods of finding the area under a curve, but you could use the calculator to check your work.
Set up the WINDOW screen as follows: If you have the calculus tools program installed:
Press APPS Select Calculus Tools and press Enter Press F3 and then 1 Press alpha and then enter: Press Enter Note: We press alpha because the screen starts in alpha lock. Make the Lower bound: 0 Make the Upper bound: 4 Make the Number of intervals: 4