Download
1 / 56
580 likes | 870 Vues
National Weather Service Overview. Faith Borden National Weather Service Las Vegas. A New Era in National Weather Service Forecast Services. Weather Ready Nation. NWS Mission.

E N D
National Weather Service Overview Faith Borden National Weather Service Las Vegas
NWS Mission • “The National Weather Service (NWS) provides weather, hydrologic, and climate forecasts and warnings for the United States, its territories, adjacent water and ocean areas, for the protection of life and property and the enhancement of the national economy.
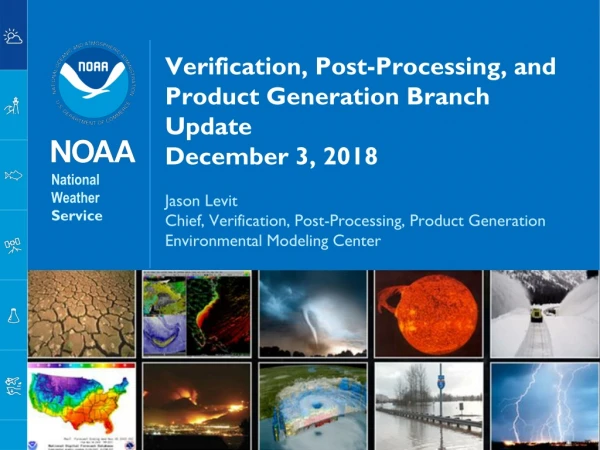
A FEDERAL AGENCY UNDER THE DEPARTMENT OF COMMERCE BRANCH OF THE NATIONAL OCEANIC AND ATMOSPHERIC ADMINISTRATION (NOAA) OPERATES 122 FIELD OFFICES, PLUS SEVERAL NATIONAL CENTERS ANNUAL BUDGET APPROXIMATELY $800 MILLION, OR LESS THAN $3.00 PER U.S. CITIZEN ABOUT 5,000 EMPLOYEES NATIONWIDE THE ONLY ENTITY TO ISSUE OFFICIAL SEVERE WEATHER WATCHES AND WARNINGS Who is the National Weather Service?
NWS Modernization History • Early 1990s • Hundreds of Automated Surface Observing Systems deployed • Mid 1990s • Number of forecast offices increase ~150% • WSR 88D deployed • 1999-2000 • AWIPS workstations fully deployed • 2003 • IFPS becomes operational • 2010-2012 • Dual Pol radar upgrades deployed • Weather Ready Nation Unveiled
NOAA’s National Weather Service • A Typical Year Brings: • 6 Hurricanes • 1,000 Tornadoes • 5,000 Floods • 10,000 Violent Thunderstorms • Severe Winter Storms • Drought and Large Wildfires • Excessive Heat Episodes • 500 Deaths; 5,000 Injuries; $14 Billion in Losses • Provide climate, water, weather forecasts and warnings to protectlife andproperty and enhance the economy • 76 billion observations • 1.5 million forecasts • 50,000 warnings
Overview of NWS Operations Central Guidance Local Offices Observe Respond & Feedback Distribute Products & Services Process Feedback
National Hurricane Center HydrometeorologicalPrediction Center T R N A E L C EnvironmentalModelingCenter Storm PredictionCenter Ocean PredictionCenter O S P N O E I R Climate PredictionCenter Aviation WeatherCenter A T Space Weather Prediction Center NWS OverviewNational Centers
NWS OverviewRiver Forecast Centers (RFCs) • Issue river, reservoir and flood forecasts based on computer models • Provide forecast guidance to Weather Forecast Offices (WFOs) • Work with water managers
NWS OverviewWeather Forecast Offices (WFOs) • Issue all Local Forecastsand Warnings • Build and Maintain RelationshipsWith Local and State Governments • Provide Expert Advice toEmergency Operations Centers • Solicit Customer Feedback on Products and Services • Conduct Community Awareness and Education Programs • Train Volunteer Observers and Storm Spotters • Research projects
National Weather Service Offices Serving Nevada Reno Elko Las Vegas
Your Las Vegas NWS Office • Responsible for 7 counties in 3 states • 70,000+ square miles • Just under 2.5 million people • Elevation change of almost 15,000 ft • Death Valley @ -282 ft • Mt. Whitney @ 14,494 ft
STAFFING • 10 CORE METEOROLOGISTS • 2 HYDROMET TECHNICIANS • 2 METEOROLOGICAL INTERN • 3 ELECTRONICS TECHNICIANS • 1 INFO TECHNOLOGY OFFICER • 2 SPECIALIST METEOROLOGISTS • 1 ADMINISTRATIVE ASSISTANT • 1 METEOROLOGIST IN CHARGE 5-7 personnel on duty M-F 2-3 personnel on duty weekends and overnight Open 24 hours a day, 7 days a week, and 365 days a year!
Short Term Desk Public Service Desk Long Term Desk
Technology Old– Surface Observations Manual observations every hour, and when conditions changed enough to warrant a special observation.
Automated Surface Observation System (ASOS) Technology New– Surface Observations Completely automated and takes observations every minute (if needed). Additionally, there are hundreds and hundreds of stations!
Weather Service Radar – 1957 technology Radar scope image – from archived film (1965) Technology Old- 57 Radar
WSR-88D – Doppler Radar Technology Newer – 88D Radar
Technology Newest –Dual Pol Radar Images from left to right: Reflectivity (Z), Differential Reflectivity (ZDR), and Correlation Coefficient (CC). The white oval shows the leading edge of the dust storm in Phoenix, AZ, on the evening of July 5, 2011, at 6:40 pm local time.
ESSA Imagery from September 1, 1966: Hurricane Faith approximately 300 miles off Cape Hatteras. Lower picture of Scandinavia in a generally cloud-free picture. Technology Old - Satellite
Visible GOES satellite image (March 10, 2008) Infrared imagery – Hurricane Dean (August 20, 2007) Technology New - Satellite
Technology keeps improving the tools Radiosonde instrument package Technology Newer– Upper Air Radiosonde launch – image courtesy of NCAR/UCAR/NSF
Technology Newest – Upper Air Profilers: These measure wind. HOWEVER, upgrades can now Provide MOISTURE information!
Weather Balloons • Released twice a day, every day • 92 sites in the US; 900 worldwide • Filled with hydrogen or helium • Flight lasts for about 2 hours; can drift as far as 125 miles away; will rise up to 100,000 feet (20 miles) • Instrument called a radiosonde is attached to measure pressure, temperature, relative humidity, wind speed and direction • Primary source of data above the ground • Provides valuable input for computer forecast models, local data for meteorologists to make forecasts and predict storms, and data for research. • Each radiosonde contains a mailing bag with instructions. About 20% of the 75,000 radiosondes sent up each year in the US are found and returned.
NOAA Weather Radio was being installed along the coasts, but was not widely used across the country until the 1970s. Teletype communications room – Weather Bureau, Nashville, TN Operating a teletype circa 1965. Technology Old – Communications
Weather Ready Nation! Data, Products, and Services to: Greatly reduce loss of life and injury Enable communities to mitigate property loss well in advance of threatening conditions Alert economic sectorsto environmental riskswith sufficient lead timeto limit or avoid impacts Where We’re Headed
Forecasts & Warnings • Based on • Numerical Model Data • Automated Observations • Doppler radar • NWS & FAA TDWR • Remote Sensing • Satellite Pictures • Law Enforcement • Volunteers • Media ASOS
How a Forecast is Made How do meteorologists make forecasts?
How a Forecast was Made 1) Forecaster Analyzes past and current state of atmosphere
How a Forecast was Made (cont.) . 2) Forecaster looks at forecast guidance from several numerical weather prediction models and develops mental image of forecast
How a Forecast was Made (cont.) ? Especially difficult in the West because of the influence of complex terrain .
How a Forecast was Made (cont.) • Once forecaster created mental image of forecast… • Typed aviation forecast • Typed public forecast • Typed fire weather forecast • Forecaster could spend up to 3 hours a day typing!
How a Forecast is Made • Forecaster then creates or modifies grids to represent what he/she thinks will happen. • Computer then generates the words which the forecaster checks before sending out.
New Forecast Method • Observed and computer forecast guidance acts as base forecast • Forecaster then adjusts gridded model forecast • Terrain compensating algorithms are run to capture terrain effects • Digital forecast database is source for traditional forecasts, new highly customized forecasts
Computer Forecasts are Input Directly into Graphical Forecast Editing Software
That means in ClarkCounty, there are about 3350 unique temperature forecasts, every hour What Does “Gridded” Mean? In this temperature field, the computer stores a unique temperature value for every 2.5 km “grid” box in the image
Compare the Amount of Data in the Grids, to the Zone Each “zone” contains one 1 temperature forecast per day, e.g. Highs 65 to 70 Each “zone” contains several hundred temperature forecasts per hour
Further “Old” vs. “New” comparison If we printed entire gridded forecast database for Nevada, it would take up ~ 84,000 pages, which is 168 reams! (Forecast is produced several times per day)
Not Restricted to Just Temperature • Temperature • Dewpoint • RH • Wind • Sky • Weather • Probability of Precipitation • Snow amounts • Rain amounts • Numerous Fire Weather Parameters
FORECASTING There are 3 basic methods of forecasting: • Persistence • Experience • Computer Modeling
PERSISTENCE: • Not much is going to change. • Tomorrow will be like today. • Works great a good deal of the time around here. • Not so good during active weather patterns such as wind storms during the spring, monsoon season, and winter storms.
EXPERIENCE: • Forecast what was seen before to repeat. • This is good for 1 to 2 day forecasts. • Works great a lot of the time. • Problem when something new happens.