Download
1 / 32
320 likes | 769 Vues
Development of and Results from the AHRQ Pharmacy Survey on Patient Safety Culture 2012 AHRQ Annual Conference September 11, 2012 Joann Sorra, PhD, Westat. Acknowledgements. Westat staff Martha Franklin Laura Gray Suzanne Streagle Naomi Dyer Theresa Famolaro Scott Smith Phuong Hoang.

E N D
Development of and Results from the AHRQ Pharmacy Survey on Patient Safety Culture • 2012 AHRQ Annual Conference • September 11, 2012 • Joann Sorra, PhD, Westat
Acknowledgements • Westat staff Martha Franklin Laura Gray Suzanne Streagle Naomi Dyer Theresa Famolaro Scott Smith Phuong Hoang • AHRQ staff Diane Cousins Deborah Perfetto Christine Crofton • James Battles • Jeff Brady • Technical expert panel members • Elaine Swift, now at NORC
What is Patient Safety Culture? “The way we do things around here” Exists at multiple levels: System Organization Department Unit Shared by staff • What is: • Rewarded • Supported • Expected • Accepted Beliefs, values & norms
Latest addition to SOPS family of surveys: Hospital Survey on Patient Safety Culture Nursing Home Survey on Patient Safety Culture Medical Office Survey on Patient Safety Culture Pharmacy SOPS to be released in October Surveys and related material available at: http://www.ahrq.gov/qual/patientsafetyculture/ Background
More than 61,000 community pharmacies One study estimated 4 errors per day in a pharmacy filling 250 prescriptions daily (2002) Survey purpose is to provide a tool for improving patient safety in community pharmacies Patient Safety in Community Pharmacies (2011) National Association of Chain Drug Stores (NACDS) 2011-2012 Chain Pharmacy Industry Profile (2002) Flynn et al. Medication Dispensing Errors in Community Pharmacies: A Nationwide Study
Reviewed literature & existing surveys Interviewed experts and pharmacy staff Identified key areas of patient safety culture Developed survey items & pretested them Obtained input from Technical Expert Panel (TEP) Piloted the survey in 55 pharmacies with 479 staff Conducted psychometric analyses Consulted with AHRQ and TEP to finalize survey Developed Toolkit materials Survey Development Process
Technical Expert Panel Anne Burns American Pharmacists Association Carmen A. Catizone Nat Assoc of Boards of Pharmacy Michael R. Cohen & Institute for Safe Medication Practices Donna Horn Laura Cranston & Pharmacy Quality Alliance David Nau James T. DeVita CVS Susan Gentilli Target Karen Hudmon & Purdue University Kyle Hultgren Kevin N. Nicholson National Assoc of Chain Drug Stores Laura Pizzi Jefferson University Rebecca P. Snead Nat Alliance of State Pharmacy Assocs Jonathan Wolfe University of Arkansas AHRQ Staff
36 items assess 11 dimensions of patient safety culture 1. Patient counseling 2. Communication openness 3. Overall perceptions of patient safety 4. Organizational learning—continuous improvement 5. Teamwork 6. Communication about prescriptions across shifts 7. Communication about mistakes 8. Response to mistakes 9. Staff training and skills 10. Physical space and environment 11. Staffing, work pressure & pace Patient safety “grade” (Excellent to Poor) Final Pharmacy SOPS Patient Safety Culture Dimensions
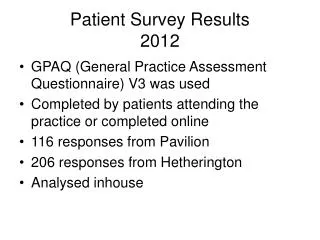
55 pharmacies across 25 states Paper surveys distributed within pharmacies Overall response rate: 75% (479 out of 635) Average number of respondents per pharmacy 9 respondents (range 5 to 20) Pilot Study
Pharmacy Characteristics • 56% had 1,500 prescriptions per week or less • 33% had a drive-through window
Staff Characteristics • 85% had at least 1 year experience in the pharmacy • 69% worked at least 32 hours per week
Psychometric Analyses • Item analysis • Dropped items with poor variability (1 item > 91% positive) • Examined % missing • Intraclass correlations (ICCs) • All but one item had ICC ≥ 0.05 indicating significant between-pharmacy variance • Initial individual-level & multilevel confirmatory factor analyses on a priori composites • 5 of 48 items had low factor loadings (< 0.40) • 5 of 13 composites had at least one model fit statistic that did not meet criterion levels • Internal consistency reliability (Cronbach’s alpha) • 3 composites had low reliability (< 0.70)
Psychometric Analyses • Based on initial analyses, made recommendations to the TEP • Dropped Compliance with pharmacy procedures (3 items) • Dropped “Documenting Mistakes” as a composite but retained it as 3 single-item measures • Dropped 13 other items from 8 composites • Pilot survey had 13 composites & 48 items; final survey has 11 composites & 36 items
All composites are significantly correlated Average: 0.46 (Range: 0.28 to 0.72) The strongest correlations: Organizational Learning—Continuous Improvement with Response to Mistakes (0.72) & Communication About Mistakes (0.71) The lowest correlations: Patient Counseling with Teamwork (0.28) & Physical Space and Environment (0.28) Correlations Among Composites
All composites significantly correlated with Overall Rating on Patient Safety Average: 0.53 (Range: 0.38 to 0.74) The strongest correlation is with Overall Perceptions of Patient Safety (0.74) The lowest correlation is with Staffing, Work Pressure and Pace (0.38) All composites significantly correlated with the 3 Documenting Mistakes items Except Physical space and environment & one documenting mistake item Correlations With Overall Rating and Documenting Mistakes
Overall Rating on Patient Safety Percent of Respondents
Frequency of Documenting Mistakes Percent of Respondents Reaches the patient & could cause harm but does not Reaches the patient but has no potential to harm Could have harmed patient, but is corrected BEFORE leaving the pharmacy
Mixed results by pharmacy “size” 1,500 or fewer RXs per week = Smaller pharmacy 1,501 or more RXs per week = Larger pharmacy On some dimensions smaller pharmacies score higher; on others they score lower Smaller pharmacies had higher scores on: Physical space and environment Smaller pharmacies 77%positive vs. 66% for larger Response to mistakes Smaller pharmacies 83% positive vs. 74% for larger Results by Pharmacy Characteristics
Smaller pharmacies scored better on Frequency of Documenting Mistakes (lower % “never” documenting is better) Reach the patient but have no potential to harm Smaller pharmacies 66% “Never documented” vs. Larger pharmacies 73% Could have harmed patient, but is corrected Smaller pharmacies 17% “Never documented” vs. Larger pharmacies 27% Larger pharmacies had higher Overall Ratings on Patient Safety Smaller pharmacies 81% “Excellent/Very Good” vs. Larger pharmacies 89% Results by Pharmacy Characteristics
Pharmacists scored higher than technicians on 10 of 11 composites Largest differences on: Organizational learning-continuous improvement Pharmacists 93% vs. technicians 81% Communication about prescriptions across shifts Pharmacists 87% vs. technicians 78% Results by Staff Position
Pharmacists were more positive about Frequency of Documenting Mistakes (lower % “never” documenting is better) Reach the patient but have no potential to harm Pharmacists 62% “Never documented” vs. Technicians 71% Could have harmed patient, but is corrected Pharmacists 9% “Never documented” vs. Technicians 28% Pharmacists had higher Overall Ratings on Patient Safety Pharmacists 88% “Excellent/Very Good” vs. Technicians 82% Results by Staff Position
Open-ended Comments • 98 respondents submitted comments (~ 20%) • Comments coded into themes • Most comments were about • Staffing • Physical space and environment • Work pressure and pace • Staff training and skills
Staffing, work pressure & pace Often the pharmacy is short-staffed and the pace is very quick which I feel is conducive to mistakes. Pharmacy is placing too much emphasis on sales and customer service, not enough on support, staffing and safety. Comments
Staffing, work pressure & pace No scheduled or unscheduled breaks for pharmacists over a 12 hour period. Telling multiple walk-in patients and drive thru customers that they can have their prescriptions in 15 minutes is not in the best interests of the patient or staff. Comments
Physical space & environment Our pharmacy is way too small for the volume of prescriptions we fill. When they remodeled our pharmacy they should have made us bigger but we work in a small environment. We are always bumping into each other and tripping over things. Comments
Staff training & skills I think our pharmacy technicians need to receive better training when they are first hired. Sometimes they aren’t trained enough which then leads to mistakes. We need more time to train: place new employees in slower locations to learn setup and receive better training. Comments
Patient counseling Pharmacists feel strongly about effective consultation with all patients as a tool to prevent errors. Patient education is a strength of this pharmacy. Customers are encouraged to ask questions and interact with our staff. Overall we do a great job concerning patient safety but there is not enough time for thorough patient counseling. Too understaffed most of the time. Comments
Toolkit materials similar to other SOPS surveys Final Survey User’s Guide Microsoft Excel®-based Data Entry and Analysis Tool Pilot study results Plans for a future Comparative Database AHRQ Support