Bedload Sampling Summary for San Joaquin River at Ledger Island: January and April 2011
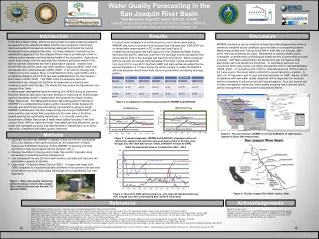
This summary outlines the bedload sampling conducted at Ledger Island on January 4-5 and April 1-2, 2011. The primary objectives were to enhance understanding of mobility thresholds for various grain sizes and to estimate sand and coarse sediment transport rates in Reach 1A. These estimates are critical for future fine sediment management, particularly for spawning and rearing habitats. The report details sampling methods, bedload discharge data at different flow rates, and outlines next steps for data distribution and additional sampling considerations.

Bedload Sampling Summary for San Joaquin River at Ledger Island: January and April 2011
E N D
Presentation Transcript
San Joaquin River Bedload Sampling summary January 4 and 5, 2011 April 1 and 2, 2011 Ledger Island
Purpose of Bedload Sampling at Ledger Island • Contribute to understanding mobility thresholds of different grain sizes (sandgravel) • Estimate sand transport rates in Reach 1A to evaluate fine sediment budget, will inform future fine sediment management for spawning and rearing habitat • Estimate coarse sediment transport rates in Reach 1A to inform future spawning gravel augmentation needs
January 4-5 and April 1-2 Friant Dam Flood Control Releases 8,060 cfs 8,090 cfs 4,690 cfs 7,000 cfs
Sample Processing • Bedload discharge < 2mm • Bedload discharge <8mm • Bedload discharge between 2mm and 8mm • Bedload discharge >8mm • Total bedload discharge
Sample Analysis • 4 passes at 4,690 cfs • 1 pass at 5,200 cfs • 1 pass at 5,800 cfs • 4 passes at 7,000 cfs • 5 passes at 8,090 cfs • 5 passes at 8,060 cfs • 4 passes at 4,000 cfs and 6,000 cfs averaged into two samples • 5 passes at 8,090 cfs and 8,060 cfs averaged into two samples
Bedload Transport Data >2mm Largest grain in transport =115 mm at 8,060 cfs
Next Steps • Prepare short tech memo summarizing methods and results • Send bedload data to SJRRP (Erin?) for distribution to Program technical staff and consultants • Technical discussion of additional sampling needs • Sampling location • Target flows • Considerations for RA/TAC Recommendations