Calibration Problem Definition
f 2. f 2. Best attainable tradeoff. Best attainable tradeoff. Worst attainable tradeoff. 1. 1. Approximate tradeoff. Reference point. f 1. f 1. 1. 1. Figure1. Normalized Hypervolume Metric for two maximization objectives.

Calibration Problem Definition
E N D
Presentation Transcript
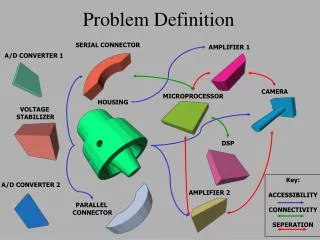
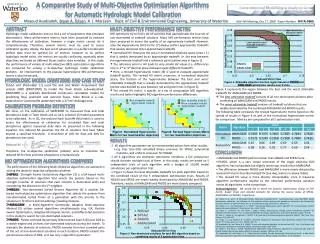
f2 f2 Best attainable tradeoff Best attainable tradeoff Worst attainable tradeoff 1 1 Approximate tradeoff Reference point f1 f1 1 1 Figure1. Normalized Hypervolume Metric for two maximization objectives Figure2. Revised Hypervolume Metric for two maximization objectives Masoud Asadzadeh, Bryan A. Tolson, A. J. MacLean. Dept. of Civil & Environmental Engineering, University of Waterloo AGU Fall Meeting, Dec 17, 2009. Paper Number: H41A-0869 ABSTRACT Multi-Objective Performance Metric Upper bound is best attainable tradeoff in comparison • MO optimizers try to find a set of solutions that approximates the true set of non-dominated or tradeoff solutions. Many MO performance metrics have been proposed to assess the quality of an approximate tradeoff. However, only the Hypervolume (HV) metric [7] always prefers approximate tradeoffs that weakly dominate other approximate tradeoffs. • normalized HV measures the area in normalized objective space (area < 1) that is weakly dominated by an approximate tradeoff; i.e. the area between the approximate tradeoff and a reference point (yellow area in Figure 1). • The reference point in HV leads to very similar HV values (i.e. differences only in 2rd or 3rd decimal place) between quite different tradeoffs. • Here, a revised hypervolume metric [8] is used to evaluate approximate tradeoff quality. This revised HV metric measures, in normalized objective space, the fraction of the hypervolume between the best and worst attainable tradeoffs that is weakly dominated by the approximate tradeoff (yellow area divided by area between red and green lines in Figure 2). • The revised HV metric is specific to a set of comparative MO algorithm results and better highlights MO algorithm performance differences. Hydrologic model calibration aims to find a set of parameters that simulates observations. Many performance metrics have been proposed to evaluate the effectiveness of calibration; however a single metric cannot do it comprehensively. Therefore, several metrics must be used to assess calibration quality. Ideally, the best set of parameters in a perfect model with perfect data must be optimal for all metrics; however as no perfect hydrologic model exists, the metrics are usually conflicting, especially when objectives are based on different fluxes and/or state variables. In this study, the performance of variety of multi-objective (MO) optimization algorithms are compared for solving a bi-objective hydrologic model calibration problem. An improvement to the popular hypervolume MO performance metric is also introduced. Lower bound is worst attainable tradeoff in comparison Hydrologic Model (SWAT2000) and Case Study Figure 4. Attainable objective function region based on PADDS and AMALGAM optimization results over 5 trials. Tolson and Shoemaker [1] used the Soil and Water Assessment Tool version 2000 (SWAT2000) to model the Town Brook sub-watershed. SWAT2000 is a spatially distributed continuous simulation model for predicting flow, sediment and nutrient fluxes. Town Brook is a sub-watershed in Cannonsville watershed with a 37 km2 drainage area. Figure 4 represents the region between the best and the worst attainable tradeoffs for AMALGAM and PADDS. The best attainable tradeoffconsists of all non-dominated solutions after combining all AMALGAM and PADDS results. The worst attainable tradeoff contains all tradeoff solutions that are weakly dominated by the combined AMALGAM and PADDS results. The following table computes the revised hypervolume metric based on the spread of results in Figure 4 as well as the normalized hypervolume metric for comparison. Metrics are computed for all 5 optimization trials. Calibration Problem Definition Approximate tradeoff We focus on the calibration of SWAT2000 to measured flow and total phosphorus loads in Town Brook and as such, selected 25 model parameters to be calibrated. As in [2], the reduced Nash-Sutcliffe (NS) metric is used to assess the effectiveness of calibration for simulated flow and total phosphorus against measured daily data. As presented in the following equation, the reduced NS penalizes the NS of solutions that have %Bias beyond a specified threshold. A threshold of 10% for flow and 30% for phosphorus was used. Therefore, the bi-objective calibration problem aims to maximize the reduced NS for flow and total phosphorus simultaneously. • All algorithm parameters set to recommended values from other studies. • e.g. Pop. Size=100, simulated binary crossover for SPEA2, polynomial mutation, and uniform crossover for NSGAII. • All 4 algorithms are stochastic optimizers; therefore, a fair comparison should consider multiple trials of them. In this study, results are based on 5 independent trials of each algorithm with a budget of 10,000 model simulations per optimization trial. • Figure 3 shows the best attainable tradeoffs for each algorithm based on the combined result of the 5 independent optimization trials. Results of NSGAII and SPEA2 are nearly weakly dominated by AMALGAM and PADDS. Therefore, results of AMALGAM and PADDS are more closely compared. • AMALGAM and PADDS perform better than NSGAII and SPEA2 here. • PADDS, which is a very simple extension of the single objective DDS algorithm, has comparable but slightly worse avg. results than AMALGAM. • The difference between PADDS and AMALGAM is more clearly detected by revised HV metric than Normalized HV (see Avg. metrics in above Table). • The revised HV value is more directly interpretable, since it measures algorithm performance relative to the observed performance variation across all algorithms in the comparison. MO Optimization Algorithms compared • The performance of the following Multi-Objective algorithms are assessed in solving the above bi-objective calibration problem: • SPEA2 - Strength Pareto Evolutionary Algorithm [3] is a GA-based multi-objective optimization algorithm that selects the parents based on the strength (number of solutions that each solution is dominated with) and considering the distance to the kth neighbor. • NSGAII - Non-dominated Sorted Genetic Algorithm [4] is another GA-based multi-objective optimization algorithm that selects the parents from non-dominated sorted fronts of a generation with the priority to the solutions in first front and considering crowding distance. • AMALGAM - A Multi-Algorithm Genetically Adaptive Multi-objective Method [5] utilizes several algorithms simultaneously (e.g. GA, Particle Swarm Optimization, Adaptive Metropolis Search, and Differential Evolution in this study) to search for non-dominated solutions. • PADDS - Pareto Archived Dynamically Dimensioned Search [6] uses DDS as a search engine and archives non-dominated solutions during the search. To maintain the diversity of solutions, PADDS samples from less crowded parts of the set of non-dominated solutions in each iteration. PADDS inherits the parsimonious nature of DDS, so it has only 1 algorithm parameter. Acknowledgement: We would like to thank the Systems Optimization Group at ETH Zurich, Jasper Vrugt and Aravind Seshadri for sharing the source codes of SPEA2, AMALGAM and NSGAII, respectively. [1]. Tolson, B. A., and C. A. Shoemaker (2004), Watershed modeling of the Cannonsville Basin using SWAT2000: Model development, calibration and validation for the prediction of flow, sediment and phosphorus transport to the Cannonsville reservoir, version 1.0, technical report, Sch. of Civ. and Environ. Eng. Cornell Univ., Ithaca, N. Y. [2]. Tolson, B. A., and Shoemaker, C. A. (2007). “Dynamically dimensioned search algorithm for computationally efficient watershed model calibration.” Water Resour. Res., 43(1), 01413 [3]. Zitzler, E., Laumanns, M., and Thiele, L. (2001). “SPEA2: Improving the strength pareto evolutionary algorithm for multiobjective optimization.” Proc., Evolutionary Methods for Design, Optimization, and Control, Barcelona, Spain, 95–100. [4]. Deb, K., Pratap, A., and Agarwal, S. (2002). “A fast and elitist multiobjective genetic algorithm: NSGAII.” IEEE Trans. Evol. Comput., 6(2), 182-197. [5]. Vrugt, J. A., and Robinson B. A. (2007). “Improved evolutionary optimization from genetically adaptive multi-method search.” Proc. Natl. Acad. Sci. U.S.A., 104(3), 708-711. [6]. Asadzadeh, M., and Tolson, B. A. (2009). “A new multi-objective algorithm, Pareto archived DDS”. Proc. 11th Genetic and Evolutionary Computation Conference GECCO., Montreal, Canada, 1963-1966. [7]. Zitzler, E., and Thiele, L. (1998), “Multiobjective optimization using evolutionary algorithms-A comparative case study,” in Parallel Problem Solving from Nature (PPSN V), Germany: Springer, 1998, pp. 292–301. [8]. Asadzadeh, M., and Tolson, B. A. “Hybrid Pareto Archived Discrete Dynamically Dimensioned Search, a New Multi-Objective Optimization Algorithm, for Solving Water Distribution Network Design Problems”. To be submitted. Figure 3. Non-dominated solutions for each MO algorithm based on combining results of 5 optimization trials