Download
1 / 87
880 likes | 1.11k Vues
Improving Student Outcomes through Progress Monitoring. Nancy Safer Jacki Bootel Rebecca Holland Coviello Virginia Department of Education September 28, 2006. Questions to Answer. What is student progress monitoring and how does it fit within an accountability agenda?

E N D
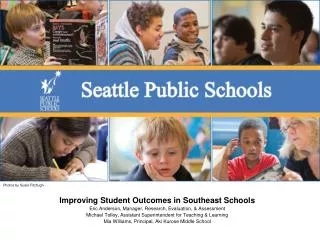
Improving Student Outcomes through Progress Monitoring Nancy Safer Jacki Bootel Rebecca Holland Coviello Virginia Department of Education September 28, 2006
Questions to Answer • What is student progress monitoring and how does it fit within an accountability agenda? • How can CBM assist all students in meeting Adequate Yearly Progress goals? • How does CBM help me as I work within a Response to Intervention model and in the identification of learning disabilities? • How does CBM help in the development of IEPs? • Where can I learn more information about student progress monitoring?
What exactly is student progress monitoring?How does it fit within an accountability agenda?
The Policy Basis for Adopting PM • No Child Left Behind focuses on the progress of sub-groups of students including SWD • IDEA 2004 focuses on early intervening and response to intervention
Progress Monitoring • Conducted frequently – at least monthly • Designed to: • Estimate rates of improvement • Identify students who are not demonstrating adequate progress • Compare the efficacy of different forms of instruction • Thereby design more effective, individualized instructional programs for struggling learners
What is the Difference Between Traditional Assessments and PM? • Traditional assessments: • Lengthy tests • Not administered on a regular basis • Teachers do not receive immediate feedback • Student scores are based on national scores and averages
What is the Difference Between Traditional Assessments and PM? • Curriculum-Based Measurement (CBM) has the strongest evidence base. • Provides an easy and quick method to gathering student progress • Teachers can analyze student scores and adjust student goals and instructional programs • Student data can be compared to teacher’s classroom or school district data
Curriculum-Based Measurement • CBM is distinctive: • Each CBM test is of equivalent difficulty • Samples the year-long curriculum • CBM is highly prescriptive and standardized • Reliable and valid scores
The Basics of CBM • CBM monitors student progress throughout the school year • Students are given probes at regular intervals • Weekly, bi-weekly, monthly • Teachers use student data to quantify short- and long-term goals that will meet end-of-year goals
The Basics of CBM • CBM tests are brief and easy to administer • All tests are different, but assess the same skills and the same difficulty level • CBM scores are graphed for teachers to use to make decisions about instructional programs and teaching methods for each student
Hypothetical Fourth-Grade Math Computation Curriculum Multidigit addition with regrouping Multidigit subtraction with regrouping Multiplication facts, factors to 9 Multiply 2-digit numbers by a 1-digit number Multiply 2-digit numbers by a 2-digit number Division facts, divisors to 9 Divide 2-digit numbers by a 1-digit number Divide 3-digit numbers by a 1-digit number Add/subtract simple fractions, like denominators Add/subtract whole number and mixed number
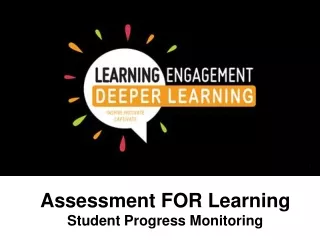
Random numerals within problems • Random placement of problem types on page
Computation 4 Sheet #2 Password: AIR Name: Date A B C D E ) 5 2 8 5 2 9 ) 8 2 8 5 9 2 4 4 7 2 + 6 4 7 0 8 4 3 0 4 x 0 9 0 + J F G H I ) 3 5 4 7 2 1 6 3 0 = x 7 4 x x 3 3 5 9 K L M N O 4 8 3 2 ) ) 5 6 5 3 1 6 3 0 - = 7 x x 2 3 6 P Q S T R 1 0 7 ) 4 1 6 5 3 2 9 6 + = 3 x 4 4 1 1 1 1 x 2 U V W X Y 1 5 0 4 1 1 3 0 ) 9 8 1 4 + 6 = 1 4 4 1 ) 5 1 0 2 7 x • Random numerals within problems • Random placement of problem types on page
Donald’s Progress in Digits Correct Across the School Year
A “Correct Digit” Is the Right Numeral in the Right Place 4507 4507 4507 2146 2146 2146 2361 2461 2441 3 correct digits 4 correct digits 2 correct digits
What We Look For in CBM • INCREASING SCORES: • Student is mastering the 4th grade curriculum. • FLAT SCORES: • Student is not profiting from instruction and requires a change in the instructional program.
Sarah’s Progress on Digits Correct Across School Year Sarah Smith Computation 4 DIGITS Sep Oct Nov Dec Jan Feb Mar Apr May
Jessica’s Progress on Digits Correct Across School Year Jessica Jones Computation 4 DIGITS Sep Oct Nov Dec Jan Feb Mar Apr May
CBM Research • CBM research has been conducted over the past 30 years • Research has demonstrated that when teachers use CBM for instructional decision making: • Students learn more • Teacher decision making improves • Students are more aware of their performance
How can CBM assist all students in meeting Adequate Yearly Progress goals?
Progress Monitoring • Evaluate effectiveness of instruction • Individual students • Entire class • Identify goals, measure goals, adjust teaching as needed • Accelerated learning • Targeted instruction • Faster attainment of state standards
Progress Monitoring and AYP • Progress monitoring can evaluate progress of a • Student • Class • Or school
Three steps for Applying CBM to the AYP Requirement • Step 1: Quantifying initial proficiency status • Step 2: Quantifying the discrepancy between initial proficiency status and universal proficiency • Step 3: Identifying AYP
Step 1 Quantifying initial proficiency status • School assesses every student using CBM • Identify number of students who meet CBM benchmarks • This number is the school’s initial proficiency status
Step 2 Quantifying the discrepancy between initial proficiency status and universal proficiency • Universal proficiency = the 2013-2014 goal of 100% proficient • Subtract initial proficiency from total number of students in the school
Step 3 Identifying AYP • Divide discrepancy by number of years remaining before 2013-2014 • This is your AYP goal or the number of students who need to reach the CBM benchmarks each year in order to achieve universal proficiency by the deadline.
AYP Example • 500 students in school • After initial assessment 314 met CBM benchmark • 500-314=186 • 186 / 7 = 26.6 • Each year between now and 2014, 26.6 more students must meet CBM benchmarks in order for this school to be on target to reach 100% proficiency by 2014
Multi-level monitoring of AYP with CBM • Level 1: Monitoring at the within-year student level • Level 2: Monitoring at the within-year teacher level • Level 3: Monitoring at the within-year school level • Level 4: Monitoring at the across-year school level
Monitoring at the within-year student level 3rd Grade benchmark Student’s current level (100) (61)
Monitoring at the within-year teacher level Number of students in one class projected to meet CBM benchmarks by the end of the year (22) Number of students in one class already meeting end of year benchmark (17) (7)
Monitoring at the within-year school level Students who have already met end of year benchmarks Target number for meeting proficiency by the end of the year (50)
Monitoring at the across-year school level Universal proficiency goal Initial proficiency level Goal line
How does CBM help me as I work within a Response to Intervention model?
Progress Monitoring in the Context of Responsiveness-to- Intervention Dr. Lynn S. Fuchs and Dr. Douglas Fuchs Excerpt from 2006 Summer Institute on Student Progress Monitoring RTI Manual
IDEA 2004 and RTI • IDEA 2004 permits use of IDEA funds for early intervening services; requires early intervening to address disproportionality • IDEA 2004 permits LEAs to use RTI as an alternative to IQ/achievement discrepancy model
IQ/Achievement Discrepancy Model • Over-identifies students • IQ tests do not necessarily measure intelligence • IQ and academic achievement are not independent from one another • Students must fail before they are identified with LDs
Response to Intervention • Students are provided with an early intervention • Students are identified as LD only after they have not responded to instruction that is effective for the vast majority of students • Assessment data is collected frequently
Approaches To Implementing RTI: Five Dimensions 1. Number of tiers (2–5) 2. How at-risk students are identified: • Percentile cut on norm-referenced test • Cut-point on curriculum-based measurement (CBM) with and without progress monitoring (PM) 3. Nature of Tier 2 preventative treatment: • Individualized (i.e., problem solving) • Standardized research-based protocol 4. How “response” is defined: • Final status on norm-referenced test or using a benchmark • Pre–post improvement • CBM slope and final status 5. What happens to nonresponders: • Nature of the abbreviated evaluation to categorize learning disability (LD), behavior disability (BD), and mental retardation (MR) • Nature of special education
Several Viable Approaches To Implementing RTI In this presentation, we feature the most widely researched model. 1.Three tiers 2. Designating risk with benchmark + PM 3. Standardized research-based Tier 2 preventative tutoring 4. Defining response in terms of CBM slope/final status 5. Nonresponders undergo abbreviated evaluation to answer questions and distinguish LD, BD, and MR • Receive reformed Tier 3 special education
Basics of RTI • RTI relies on a multi-tier prevention system to identify students with LDs: • Primary prevention • Secondary prevention • Tertiary prevention
Continuum of School-wide Support ~5% Tertiary Prevention: Specialized individualized systems for students with intensive needs ~15% Secondary Prevention: Specialized group systems for students with at-risk behavior Primary Prevention: School-wide and class-wide systems for all students, staff, and settings ~80% of students
Basics of RTI • Primary Prevention (Tier 1): • All students screened to find suspected at-risk students • Suspected at-risk students remain in primary prevention and are assessed using progress monitoring • Responsive students remain in primary prevention • Unresponsive students move to next tier
Basics of RTI • Secondary Prevention (Tier 2): • Research-based tutoring. • Provided in small groups. • Student progress is monitored weekly. • Responsive students return to primary prevention. • Unresponsive students move to next tier.
Basics of RTI • Tertiary Prevention (Tier 3): • Special education services. • Individualized education program (IEP) goals. • Individualized instructional programs. • Student progress is monitored weekly. • Responsive students return to secondary or primary prevention. • Unresponsive students remain in tertiary prevention.
Three Tiers of RTI TIER 1: Primary Prevention - General education setting - Research-based instruction - Screening to identify students suspected to be at risk - PM to (dis)confirm risk status AT RISK RESPONSIVE or TIER 2: Secondary Prevention - Validated or researched-based tutoring - PM to assess responsiveness UNRESPONSIVE RESPONSIVE TIER 3: Tertiary Prevention - Special education - CBM to set IEP goals - PM to formulate individualized programs - PM to assess responsiveness UNRESPONSIVE
Typical RTI Procedure • All students screened to identify suspected at-risk students. • Progress of suspected at-risk students is monitored and students with confirmed risk require more intensive tutoring. • At-risk students receive secondary prevention tutoring and progress is continually monitored.
Typical RTI Procedure (continued) • Students unresponsive to secondary prevention tutoring move to tertiary prevention and receive comprehensive evaluation to answer questions and determine disability. • Progress is monitored in tertiary prevention to set IEP goals, formulate effective programs, and decide responsiveness-to-intervention.
Progress Monitoring and RTI • PM is an essential tool for RTI. • With PM, student academic performance is assessed using brief measures. • PM takes place frequently (generally weekly) using alternate forms. • Decisions are made based on PM