Download
1 / 23
230 likes | 427 Vues
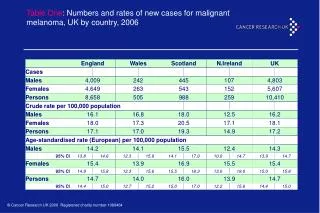
Table One : Numbers and rates of new cases for malignant melanoma, UK by country, 2006. Figure One : Percentage distribution of malignant melanoma on parts of the body. Figure Two : Numbers of new cases and age specific incidence rates, by sex, malignant melanoma, UK 2006.

E N D
Table One: Numbers and rates of new cases for malignant melanoma, UK by country, 2006
Figure One: Percentage distribution of malignant melanoma on parts of the body
Figure Two: Numbers of new cases and age specific incidence rates, by sex, malignant melanoma, UK 2006
Figure Three: Melanoma incidence by health authority, males, UK and Ireland, 1991-1999
Figure Four: European age-standardised* incidence rates, malignant melanoma by sex, EU, 2002 estimates * to the European standard population
Figure Five: World age-standardised* incidence rates, malignant melanoma, by sex, 2002 estimates * to the European standard population
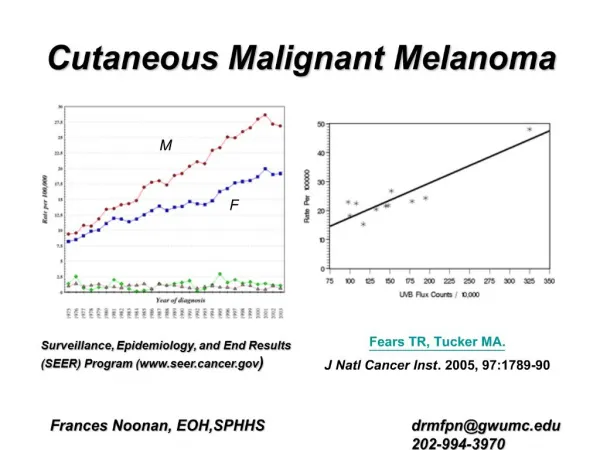
Figure Six: Age-standardised* (European) incidence rates, malignant melanoma, by sex, Great Britain, 1975-2006 * to the European standard population
Figure Seven (a): Age-specific incidence rates, malignant melanoma, males, Great Britain 1975-2006
Figure Seven (b): Age-specific incidence rates, malignant melanoma, females, Great Britain 1975-2006
Figure Eight: Solar UV Radiation in relation to the Earth and ozone layer
Table Two: Age-standardised incidence rates* per 100,000 population for malignant melanoma, by race and sex, 1998-2002, USA
Figure Nine: Percentage of men and women who used a sunbed or tanning machine in the past 6 months, Great Britain, 1999
Table Three: Categories of people who should not use sunbeds as recommended by WHO
Table Six: Tumour thickness, excision margins, survival and follow-up
Figure Ten: Five-year age-standardised* survival for patients aged 15-99 diagnosed with malignant melanoma, by sex, England and Wales, 1971-2006 * to the European standard population
Figure Eleven: Five-year survival by tumour thickness, patients diagnosed 1979-1998, by sex, Scotland
Figure Twelve: Age-standardised* five-year relative survival rate, by age, malignant melanoma, by sex, England and Wales, 2001-2006 * to the European standard population
Table Seven: Numbers of deaths and rates for malignant melanoma, UK by country, 2007
Figure Thirteen: Numbers of deaths and age-specific mortality rates by sex, malignant melanoma, UK, 2007
Figure Fourteen (a): Age-specific mortality rates, malignant melanoma, males, UK, 1971-2007
Figure Fourteen (b): Age-specific mortality rates for malignant melanoma, females, UK, 1971-2007