1 / 51

2 pt

Place Value. Data Analysis. Variables. Decimals. Mental Math. 1pt. 1 pt. 1 pt. 1pt. 1 pt. 2 pt. 2 pt. 2pt. 2pt. 2 pt. 3 pt. 3 pt. 3 pt. 3 pt. 3 pt. 4 pt. 4 pt. 4pt. 4 pt. 4pt. 5pt. 5 pt. 5 pt. 5 pt. 5 pt. Write the place value of the underlined digit. 56.4 2 1.

amos-good
Télécharger la présentation

2 pt

An Image/Link below is provided (as is) to download presentation Download Policy: Content on the Website is provided to you AS IS for your information and personal use and may not be sold / licensed / shared on other websites without getting consent from its author. Content is provided to you AS IS for your information and personal use only. Download presentation by click this link. While downloading, if for some reason you are not able to download a presentation, the publisher may have deleted the file from their server. During download, if you can't get a presentation, the file might be deleted by the publisher.

E N D

Presentation Transcript


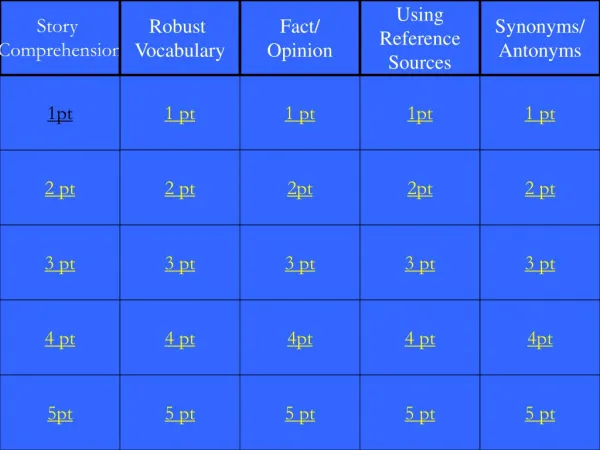
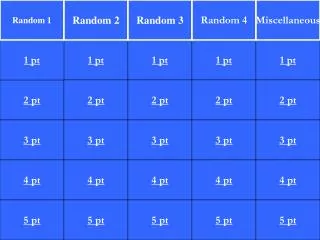
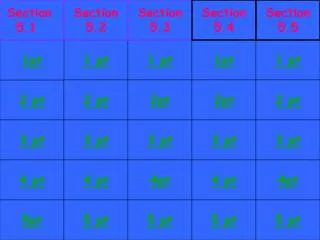
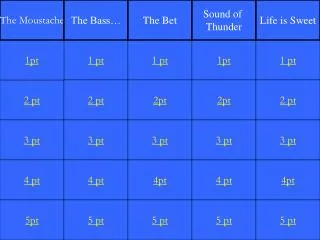
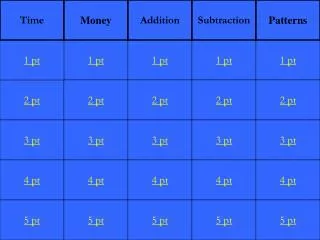
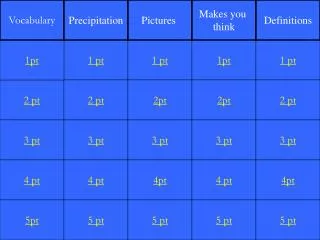
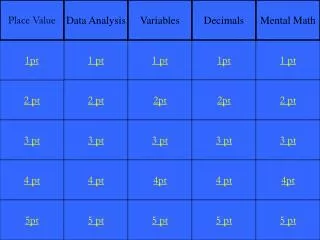
  1. Place Value Data Analysis Variables Decimals Mental Math 1pt 1 pt 1 pt 1pt 1 pt 2 pt 2 pt 2pt 2pt 2 pt 3 pt 3 pt 3 pt 3 pt 3 pt 4 pt 4 pt 4pt 4 pt 4pt 5pt 5 pt 5 pt 5 pt 5 pt

  2. Write the place value of the underlined digit.56.421

  3. 56.421hundredths place

  4. What is the whole number portion of the decimal?417. 0438

  5. 417

  6. What is the place value of the underlined digit?34.3269

  7. 34.3269The nine is in the ten thousandths place.

  8. Write this in number form.Six hundred forty two ten-thousandths

  9. Six hundred forty two ten-thousandths0.0642

  10. Write this number in expanded form.31.0456

  11. 31.0456 = 30 + 1 + 0.04 + 0.005 + 0.0006

  12. Which type of graph would be the best for comparing the annual rainfall in Phoenix, Arizona and San Antonio, Texas?A. Circle graphB. Scatter-plotC. Line GraphD. Bar Graph

  13. C. Bar graph

  14. Find the mode of this set of data.Be ready to explain your answer.74, 67, 54, 66, 80, 77, 70, 82, 79, 84, 75

  15. No modeThere is no number that occurs more often than the others in the data set.

  16. Find the range in this set of data.-2, 6, 5, -4, 6, 3, 2

  17. The range is 10.

  18. Find the median in this set of data.215, 207, 210, 208, 211, 205, 215,

  19. The median is 210.205, 207, 208, 210, 211, 215, 215

  20. Find the mean in this set of data.5.3, 2.7, 3.1, 4, 5.8

  21. The mean is 4.18

  22. Solve the equation for the variable.27 = y + 12 y =

  23. y = 15

  24. Solve the equation.z - 31 = 17

  25. z = 48

  26. Solve the equation.47 = a + 36

  27. a = 11

  28. Solve the equation.76 = y - 18

  29. y = 94

  30. Solve the equation.9n + 1 = 73

  31. n = 8

  32. Where does the decimal belong?0.7 X 12 = A. 0.84B. 0.084C. 8.4D. 84.0

  33. C. 8.4

  34. 27 + 0.185 =

  35. 27 + 0.185 = 27.185

  36. 2.57 + 7.762 + 0.5 =

  37. 2.57 + 7.762 + 0.5 =10.832

  38. 15 – 6.108 =

  39. 15 – 6.108 = 8.892

  40. If n = 1.78, which equation is true?A. n – 0.3 = 2.08B. 2.3 + n = 4.08C. n + 0.3 = 1.48D. 5 – n = 4.22

  41. B. 2.3 + n = 4.08

  42. Greater, equal or less than?656.07 656.23

  43. 656.07 < 656.23

  44. 8.7 X 100 =

  45. 8.7 X 100 = 870

  46. 0. 64 ÷ 10 =

  47. 0. 64 ÷ 10 = 0.064

  48. 2x = 38x =

  49. 2x = 38x = 19

  50. 10 x 10 x 10 x 10 x 10 x 10 =

More Related