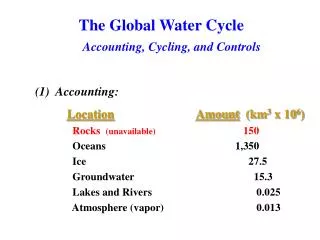
Current Changes in the Global Water Cycle
This document reviews the significant changes occurring in the global water cycle due to climate change, highlighting the vulnerability of freshwater resources. It discusses observational records, climate projections, and the observed trends in precipitation, including increased rainfall intensity and the drying of certain regions. The role of satellite data and climate models in understanding these variations is considered, along with the potential consequences for human societies and ecosystems. The importance of improving predictability of regional changes in water resources is emphasized.

Current Changes in the Global Water Cycle
E N D
Presentation Transcript
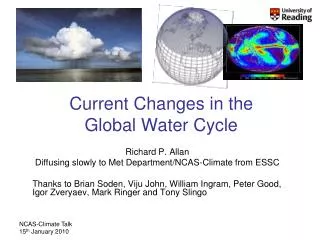
Current Changes in the Global Water Cycle Richard P. Allan Diffusing slowly to Met Department/NCAS-Climate from ESSC Thanks to Brian Soden, Viju John, William Ingram, Peter Good, Igor Zveryaev, Mark Ringer and Tony Slingo
Introduction “Observational records and climate projections provide abundant evidence that freshwater resources are vulnerable and have the potential to be strongly impacted by climate change, with wide-ranging consequences for human societies and ecosystems.” IPCC (2008) Climate Change and Water
How should the water cycle respond to climate change? Precipitation Change (%) relative to 1961-1990: 2 scenarios, multi model (IPCC, 2001) See discussion in: Allen & Ingram (2002) Nature; Trenberth et al. (2003) BAMS
Climate model projections (IPCC 2007) Precipitation Intensity • Increased Precipitation • More Intense Rainfall • More droughts • Wet regions get wetter, dry regions get drier? • Regional projections?? Dry Days Precipitation Change (%)
Physical basis: energy balance Trenberth et al. (2009) BAMS
Models simulate robust response of clear-sky radiation to warming (~2-3 Wm-2K-1) and a resulting increase in precipitation to balance (~3 %K-1)e.g. Allen and Ingram (2002) Nature, Stephens & Ellis (2008) J. Clim, Lambert and Webb (2008) GRL Allan (2009) J Clim Radiative cooling, clear (Wm-2K-1)
Physical basis: water vapour 1979-2002 • Clausius-Clapeyron • Low-level water vapour (~7%/K) • Intensification of rainfall • Moisture transport • Enhanced P-E patterns See Held and Soden (2006) J Clim
Evaporation Richter and Xie (2008) JGR CC Wind Ts-To RHo Muted Evaporation changes in models are explained by small changes in Boundary Layer:1) declining wind stress2) reduced surface temperature lapse rate (Ts-To)3) increased surface relative humidity (RHo)
Current changes in the water cycleAs observed by satellite datasets and simulated by models
Current changes in tropical ocean column water vapour John et al. (2009) Water Vapour (mm) models AMIP3CMIP3CMIP3 volc Allan (2009) …despite inaccurate mean state, Pierce et al.; John and Soden (both GRL, 2006) - see also Trenberth et al. (2005) Clim. Dyn., Soden et al. (2005) Science ERA40 NCEP ERAINT SSM/I
Tropical ocean precipitation • dP/dSST: GPCP: 10%/K(1988-2008) AMIP: 3-11 %/K(1979-2001) • dP/dt trend GPCP: 1%/dec (1988-2008) AMIP: 0.4-0.7%/dec (1979-2001) (land+ocean) SSM/I GPCP
GPCP Ascent Region Precipitation (mm/day) Wet (ascent) and Dry (descent) regimes • Robust response: wet regions become wetter at the expense of dry regions • Large uncertainty in magnitude of change: satellite datasets and models & time period TRMM John et al. (2009) GRL
Contrasting precipitation response in wet and dry regions of the tropical circulation ascent Observations Models Precipitation change (%) descent Sensitivity to reanalysis dataset used to define wet/dry regions Updated from Allan and Soden (2007) GRL
Avoid reanalyses in defining wet/dry regions • Sample grid boxes: • 30% wettest • 70% driest • Do wet/dry trends remain?
Current trends in wet/dry regions of tropical oceans • Wet/dry trends remain • 1979-1987 GPCP record may be suspect for dry region • SSM/I dry region record: inhomogeneity 2000/01? • GPCP trends 1988-2008 • Wet: 1.8%/decade • Dry: -2.6%/decade • Upper range of model trend magnitudes DRY WET Models
Precipitation Extremes • Trends in tropical wet region precipitation appear robust. • What about extreme precipitation events? • Analyse daily rainfall over tropical oceans • SSM/I satellite data, 1988-2008 • Climate model data (AMIP experiments) • Create monthly PDFs of rainfall intensity • Calculate changes in the frequency of events in each intensity bin • Does frequency of most intense rainfall rise with atmospheric warming? METHOD
Increases in the frequency of the heaviest rainfall with warming: daily data from models and microwave satellite data (SSM/I) Reduced frequency Increased frequency Updated from Allan and Soden (2008) Science
Increase in intense rainfall with tropical ocean warming (close to Clausius Clapeyron) • SSM/I satellite observations at upper range of model range No apparent link to convection scheme? What about CMIP experiments? e.g. Turner and Slingo (2009) ASL
One of the largest challenges remains improving predictability of regional changes in the water cycle… Changes in circulation systems are crucial to regional changes in water resources and risk yet predictability is poor. How will catchment-scale runoff and crucial local impacts and risk respond to warming?
Precipitation in the Europe-Atlantic region (summer) Dependence on NAO
Current changes in the water cycle over Europe-Atlantic region Water vapour Precipitation
Outstanding issues • Are satellite estimates of precipitation, evaporation and surface flux variation reliable? • Are regional changes in the water cycle, down to catchment scale, predictable? • How well do models represent land surface feedbacks. Can SMOS mission help? • How is the water cycle responding to aerosols? • Linking water cycle and cloud feedback issues
Conclusions • Robust Responses • Low level moisture; clear-sky radiation • Mean and Intense rainfall; Observed • precipitation response at upper end of model range? • Contrasting wet/dry region responses • Less Robust/Discrepancies • Moisture at upper levels/over land and mean state • Inaccurate precipitation PDFs • Magnitude of change in precipitation in satellite datasets/models • Further work • Decadal changes in global energy budget, aerosol forcing effects and cloud feedbacks: links to water cycle • Precipitation and radiation balance datasets: forward modelling • Surface feedbacks: ocean salinity, soil moisture (SMOS?) • Boundary layer changes and surface fluxes
Wet Dry DISCUSSION dPw/dT=7%/K dPd/dT Assume wet region follows Clausius Clapeyron (7%/K) and mean precip follows radiation constraint (~3%/K) Pw=6 mm/day Pd=1 mm/day A=0.4 (1-A)=0.7 P=3 mm/day dP/dT=3%/K A is the wet region fractional area P is precipitation T is temperature
Wet Dry dPw/dT=7%/K dPd/dT Assume wet region follows Clausius Clapeyron (7%/K) and mean precip follows radiation constraint (~3%/K) dP/dT= A(dPw/dT)+(1-A)(dPd/dT) dPd= (dP-AdPw)/(1-A) Pw=6 mm/day Pd=1 mm/day A=0.4 (1-A)=0.7 P=3 mm/day dP/dT=3%/K A is the wet region fractional area P is precipitation T is temperature
SMOS ESA’s SMOS (Soil Moisture and Ocean Salinity) launched November 2009 Evaporation changes over land are not globally measured. New data on soil moisture could be vital in understanding changes in evaporation and regional water cycle feedbacks over land. The addition of ocean salinity measurements are also of potential value in understanding P-E changes and ocean circulating response Courtesy of Ian Davenport
Cloud Feedback • Can HadIR provide any information on cloud feedback • For example, the FAT hypothesis (fixed anvil temperature): • Anvil outflow determined by position of zero radiative cooling • …which is determined by the rapid decline in water vapour with altitude • …which is determined by Clausius Clapeyron • Hypothesis: As temperature rises, outflow rises in altitude but not temperature which remains fixed • e.g. Hartmann and Larson (2003); Zelinka and Hartmann in press
Are the issues of cloud feedback and the water cycle linked? 2008
Response of the hydrological cycle is sensitive to the type of forcing Andrews et al. (2009) J Climate Partitioning of energy between atmosphere and surface is crucial to the hydrological response; this is being assessed in the PREPARE project
How does UTH respond to warming? Minschwaner et al. (2006) J Clim Lindzen (1990) BAMS Mitchell et al. (1987) QJRMS
Precipitation projections (IPCC) Radiation budget, hydrological cycle and climate feedbacks Decadal changes in water vapour, precipitation and its extremes are beginning to be detected Precip. (%) Allan and Soden (2008) Science