Download
1 / 24
240 likes | 263 Vues
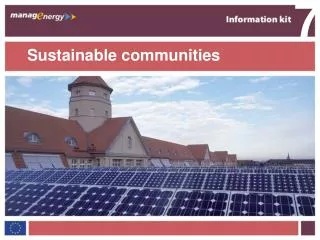
Betsy Smith, Ph.D . Sustainable and Healthy Communities Research Program CEC JPAC Workshop Merida, Yucatan, Mexico Dec. 13, 2012. Ecosystem Vulnerability: Assessment Approaches from EPA’s Regional Vulnerability Assessment (ReVA) Program. What Makes an Ecosystem “Vulnerable”?. Condition

E N D
Betsy Smith, Ph.D. Sustainable and Healthy Communities Research Program CEC JPAC Workshop Merida, Yucatan, Mexico Dec. 13, 2012 Ecosystem Vulnerability: Assessment Approaches from EPA’s Regional Vulnerability Assessment (ReVA) Program
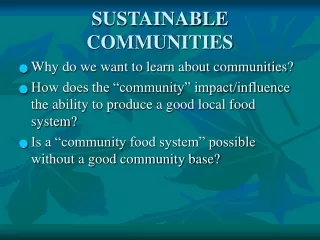
What Makes an Ecosystem “Vulnerable”? • Condition • Pristine, Good, Stressed, Degraded • Sustainability • f (ecosystem sensitivity, resiliency; stressors affecting) • Value to Society • Aesthetics, Economic Opportunities, Goods and Services What Drives Risk Management Decisions? • Feasibility, Clear Options, Economics • What works where?, Range of method applicability
ReVA Overview Problem Given multiple stresses affecting multiple endpoints simultaneously, how can limited resources be targeted to maximize benefits and minimize problems? How do we incorporate various perspectives to balance among competing priorities? Clients EPA Regional Offices (enforce regulations) EPA Program Offices (set regulations) State and Local Decision-makers (manage compliance with regulations) ....Anyone faced with this and no tools at hand to do it well...
Future Scenarios: Projections of Major Drivers of Ecological Change • In the US, despite compliance with environmental regulations, biological populations are continuing to decline. • Major drivers of change include: • Land use change • Resource extractions • Pollution and pollutants • Exotic invasive species • Climate change
Projecting Land Use Change • Suite of methods: • Economics • Planned roads, developments • Rural and urban change • Input into decisions affecting • Conservation of native biodiversity • Increased risk of flooding • Nonpoint source pollution • Urban sprawl/quality of life • Drinking water quality and supply • Pests and pathogens in forests • Economic opportunities
Resource Extraction and Special Areas Low High • Globally-unique area in terms of intact, deciduous, temperate forest • Among the most biodiverse areas • Habitat for large migratory species • Highest unemployment in region • Targeted by • Mountain-top removal mining • Expansion of chip mills from SE • Potential Impacts on • Native biodiversity • Water quality • Quality of life Projected Change in Hardwood Removals in the Mid-Atlantic Region through 2020 Current patterns of forest fragmentation
Current and Future (2020) Projections for the Mid-Atlantic Region Drivers of EcologicalChange Giant Salvinia Land use/ land cover Modeled using GARP Modeled using SLEUTH Modeled using CMAQ
Where will valued resources be subjected to additional stress? Use by EPA Regional Offices to prioritize management options Watersheds in blue are candidates for use of Region 3’s discretionary funds for water monitoring, continuing existing projects, initiating new projects, partnerships with local communities for responsible development…..
Charlotte MSA North Carolina Mecklenburg County Adjacent Counties South Carolina Demonstrating Trade-offs Sustainable Environment for Quality of Life • Promotes integrated planning to protect the environment and quality of life while promoting economic win-wins • Landmark regional partnership for integrated planning • One of the first of its kind in the nation • 15-county region, encompassing approximately 10,000 square miles • Federal, State, and Local Governments in partnership
Growth as Usual Centers of Development Choices:Development Alternatives OR Resulting patterns of land consumption
Alternative Scenarios of Development • Medium Density Development • Fewer Houses per Acre • More Land Consumption • Decentralized Employment • Growth Less Linked to Transit • Compact Centers Development • More Houses per Acre • Less Land Consumption • Centralized Employment • Growth Linked to Transit
High Density Low Density Net Changes, all metrics combined Watersheds in yellow showed better overall conditions resulting from high density development over low density (sprawl)
Change drivers of interest for Midwestern place-based study Energy Independence and Security Act mandates increased production and use of biofuels • Biofuels • Potential for rapid, large-scale changes in land use or land management • Implicit trade-offs among ecosystem services • Agricultural conservation practices • Existing area of large investment, uncertain benefit • Increasing interest in ecosystem service-based incentives and markets Locations of ethanol biorefineries and FML boundary Conservation Reserve Program Participation($/acre)
Projection of 2022 landscape changes due to biofuel targets:Parcel change from corn/soybean to continuous corn Detail for Corn Belt area in Illinois In the Corn Belt, corn/soybean rotation will change to continuous corn, requiring greater chemical inputs and depleting soil productivity Base Year (2001) Biofuel Targets (2022) Corn/soybean rotation Continuous corn
Implications of Forecast Change: Increase in nitrogen fertilization Increase in corn production Corn production change (bushels per 30-m raster) Increase in atrazine application
Combining spatial data to improve community exposure estimates Atrazine application + individual surface water use + population density
Exposure: Service value is related to the ability to mitigate or reduce risk Estimated Atrazine application for Base Year landscape Combined index: Atrazine application and population using surface water supplies Potential risk only – incomplete endpoint Risk + Exposure – a better endpoint 17 17
Integration of Spatial Data: the Method Used Matters! All of these maps were produced using the same set of data; only the integration method differs Should ask: Is the method robust given the data being synthesized? Is the method addressing the right question? For more info on see www.epa.gov/reva : Guidelines to Assessing Regional Vulnerability
National, coast-to-coast , scalable coverage of metrics for: • ecosystem services • built environment • demographics • drivers of change (e.g. pollution, population growth, development) • Analytical tools to: • screen • compare • assess • evaluate scenarios EnviroAtlas • Hi-resolution classification and analysis for 250 urban areas across country • linking ecosystem services to human health and well-being • allowing queries on subpopulations of concern • identifying actions to mitigate pollution and reduce energy costs
Potential for Tree Cover to Buffer Airborne Pollutants from Busy Roadways (estimated threshold is > 25% cover within 26m of road edge) Greater Durham, NC (Chapel Hilldetail)