Download
1 / 28
280 likes | 525 Vues
Learn about social stratification, class theories, mobility, impact on life, and global wealth distribution in a comprehensive exploration of social class systems. Understand the complexities of social hierarchy and economic disparities.

E N D
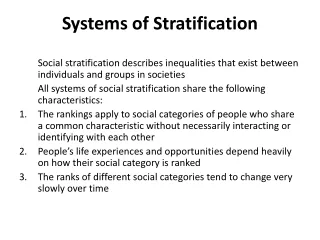
Systems of Stratification • Social stratification describes inequalities that exist between individuals and groups in societies • All systems of social stratification share the following characteristics: • The rankings apply to social categories of people who share a common characteristic without necessarily interacting or identifying with each other • People’s life experiences and opportunities depend heavily on how their social category is ranked • The ranks of different social categories tend to change very slowly over time
Four Basic Systems of Stratification • Slavery: • Extreme form of inequality where certain people are owned as property by others • Caste: • Closed system in which social status is given for life, e.g. India and South Africa • Estates: • Feudal estates were strata with differing rights and obligations towards each other. Localised in Europe. • Class: • Large-scale groupings who share common economic resources; these in turn shape their possible lifestyles
What’s Different about Class? • Class systems are fluid • Not established by legal or religious means • No (formal) restrictions on intermarriage • Class positions are in some part achieved • Individual’s class is not simply given at birth • Social mobility is a common feature • Class is economically based • Inequalities in the possession of material resources • Class systems are large scale and impersonal • No personal relationships of duty and obligation
Theories of Social Class I • Karl Marx • A group of people who stand in a common relationship to the means of production • Two main groups: those who own capital and those who own only their labour • Exploitative relationship: ‘surplus value’ • Ongoing process leading to ‘pauperization’ of those at the bottom
Marx’s Capital • Marx's object in Capital was to explain capital as a social relation in the fullest dialectical sense and in the process to describe its law(s) of motion. he "best parts" of his work were the distinction between use value and exchange value, between labor and labor power, and the analysis of surplus value independent of its particular forms as profit, interest, and rent. the concept of the rate of surplus value (rate of exploitation) was Marx's crowning achievement. his notions of the incessant revolutionization of production(requiring a more and more detailed division of labor), the reserve army of labor (or relative surplus population), and the concentration and centralization of capital.
Theories of Social Class II • Max Weber • Still based on conflicts over power and resources, but more multi-dimensional • Class is accompanied by status and party • Market position is a crucial concept • Life chances depend not just on the means of production but on skills & qualifications
Two challenges to class analysis • Lifestyle • Arguments about ‘the cultural turn’ • Symbols and markers based on consumption • Bourdieu: four forms of capital • Gender and Stratification • Female class once driven by husbands and fathers • Critiques: • women’s work can influence household’s economic position • Cross-class households • Woman could be dominant earner
Social Mobility • Fair amount of upward and downward mobility, and concerned with both • Intra-generational mobility (individuals’ own careers) • Inter-generational mobility (children vs. parents) • Absolute mobility is moving from one class to another – real experience for someone! • Relative mobility (sometimes ‘fluidity’) looks at comparative chances for individuals in each class of making it to a particular destination
Class (Still) Matters • Ongoing argument about access to various desirable goods: educational achievement, university admission, etc. • Meritocracy: ability + effort = achievement (Saunders – ‘unequal but fair’) • Class membership continues to correlate with inequalities of life expectancy, health outcomes and lifetime income
The Shape of Global Inequality • World Bank divides countries into three bands, according to their Gross National Income (GNI) • High-income countries: 15% of population, 79% world’s wealth • Middle-income countries: 45% of population, 18% of world wealth • Low-income countries: 40% of population, 3% of world wealth
Share of World Private Consumption Expenditure Expenditure (%) Population(%) • US + Canada------- 31.5--- - 5.2 • Western Europe---- 28.7--- - 6.4 • Australia+ • New Zealand-------- 1.5---- - 0.4 • 12 % Rich account for 61.7 % of the World Consumption • State of the World: The Consumer Society • (World watch Institute 2004)
Production concentrates in big cities, leading provinces, and wealthy nations. Half the world’s production fits onto 1.5 percent of its land. Cairo produces more than half of Egypt’s GDP, using just 0.5 percent of its area. Brazil’s three south-central states comprise 15 percent of its land, but more than half its production. North America, the European Union, and Japan—with fewer than a billion people—account for three-quarters of the world’s wealth. But economic concentration leaves out some populations. In Brazil, China, and India, for example, lagging states have poverty rates more than twice those in dynamic states. More than two-thirds of the developing world’s poor live in villages. A billion people, living in the poorest and most isolated nations, mostly in Sub-Saharan Africa and South and Central Asia, survive on less than 2 percent of the world’s wealth. Foreword to WDR 2009 by Robert B. Zoellick, 6th Nov. 2008 1/2/2020 13
Characteristics of Contemporary World • Extreme Inequalities • Among regions, among nations, within nations largely due to • Uneven Development • Neoliberal economic policies & their export to the rest of the world through Globalization
High Income - OECD countries • GDP (2005) -35,528.8 Billion $ • Population – 1,011 Millions • World economy- Domination by 500 global Corporations generating revenue of $ 20,900.3 Billions of which OECD countries based Companies- 452 with 2006 Revenue - $ 20 Trillion
GROSS EXPENDITURE ON RESEARCH DEVELOPMENT 1/2/2020 17
Inequalityis far greater still if we look at matters from a global standpoint. In 2006 Bill Gates's wealth was equal to that of the combined GDP of Ethiopia, Niger, the Congo, Burundi, Sierra Leone, Liberia, the Central African Republic, Namibia, Lesotho, Malawi, and Tanzania in Africa -- 226 million people. Figure 1. Productivity and average wages in the US, 1947-2004
Inequality • At the end of 2008, the world’s population of HNWIs was 8.6 million (0.13% of world population), and their wealth was $32.8 trillion • (nearly half of global GNW of $ 69 trillion). • Ultra-HNWIs accounted for 34.7% of global HNWI wealth ($11.38 trillion), but only 0.9% of the total HNWI population (77400). • The U.S., Japan and Germany together accounted for 54.0% of the world’s HNWI population in 2008. • GNW- Gross National wealth; HNWI-High Net Worth Individual; UHNWI-Ultra High Net Worth Individual
World Richest • 946 Billionaires with Combined net worth $3.5 Trillion • US – 400 with $ 1.3 Trillion • Japan- 24 ; Germany-30 ; UK- 29 • France-15; Russia -53; Turkey-25 • India-36; China-20, Hong-Kong-21 • Mexico-10; Brazil-20; S.Arabia-13 • from Forbes – March 2007
Rising Inequality in China • China had 250,000 U.S. dollar millionaire households (excluding the value of primary residence) in 2005, the sixth greatest national total in the world. Although this group made up only 0.4% of China's total households, it held 70% of the country's wealth. According to a yearly listing of China's richest people, the number of U.S. dollar billionaires has grown from one in 1999 to 106 in 2007 (more than any other country except the United States).(Boston Consulting Group} 1/2/2020 21
India's 40 Richest • India's rising fortunes are underscored by the increasing prosperity of its wealthiest citizens. Members of our third annual ranking of India's 40 richest businesspeople are worth a collective $170 billion, up from $106 billion last year. India's top 10, worth $112 billion, account for two-thirds of that wealth. The rankings include 36 billionaires, 9 more than last year. India's hot stock market, up 39% this year, and its robust real estate market helped swell most fortunes. The minimum net worth needed to make the cut rose to $790 million, up from $590 million (Forbes India Dec. 2009)
Highly Unequal World • Richest 2 percent of adults in the world own half the world’s wealth • Richest 1 percent of adults owned 40 percent of global assets in the year 2000, and the richest 10 percent of adults accounted for 85 percent of the world ‘s total • In contrast half of world’s adult population accounts for barely 1 percent of global wealth. • Average American’s wealth in the year 2000 was more than 100 times higher than the average Indian or Indonesian. • World Institute for Development Economics Research, United nations University, Helsinki, Finland
According to ADB, the number of poor in India was anywhere between 622 to 740 million in 2005, well over double the official Planning Commission estimates. in 2005 India had the second highest poverty ratio (54.8%) among all the Asian countries studied, next only to Nepal (55.8%) and higher than Bangladesh (42.9%), Cambodia (36.9%), Bhutan (31.8%), Philippines (29.5%), Pakistan (24.9%), Indonesia (24.1%),Vietnam (16.0%), Sri Lanka (9.9%) and Malaysia and Thailand (0%). Asian Development Bank,“Key Indicators for the Asia and the Pacific 2008”
CHANGES IN GINI COEFFICIENTS, 1990s-2000s (percentage points)
Inequality in Pakistan • Shahid Javed Burki, a well known economist, has for the purpose of public policy-making categorized the population of the Pakistan into groups, the very-poor and the not-so-poor number 90 million heads (56.5 per cent of the population) who earn per-capita income per day ranging from 95 cents to $1.16. 50 million the middle class with per capita income of $1,000; 16 million well-to-do with income of $2,700 and 0.2 million with income of $20,000 per capita. Source: S.J. Burki, ‘Inequality and conflict’ (Dawn, Dec 12, 2006)
Stratification in Pakistan • The 50,000 or so families that fit in the income category of the very rich owe their wealth and income either to land they have owned for decades, perhaps for centuries, or to the industries they established since the birth of Pakistan, or to dealings in properties that are now valued very highly at the peripheries of the major cities. In all these cases the state has either helped in protecting the source of income or assisted in creating the wealth that produces it. • Those who populate the upper echelons of the economic society of Pakistan were not always in that position. This is one of the unique features of Pakistani society; a lot of the wealth that produces these incomes is of recent origin which is not the case in most of the developing world. SJBurki, Dawn Dec. 12, 2006
Stratification in Pakistan---- • On the basis of class, status and power that sometimes overlaps with geography (e.g., arid, mountainous and desert areas) that provide the bulk of unskilled labour, domestic workers, police, military and secretarial workers at lower levels. • Ethnicity / religion : minorities ( sanitary workers) • Bonded labour (kiln workers, carpet weaving)