Download
1 / 52
530 likes | 636 Vues
Explore the foundational concepts of the Law of Demand and Law of Supply through graphs and determinants, understanding shifts in demand and supply curves based on factors like consumer tastes, prices of other goods, and more.

E N D
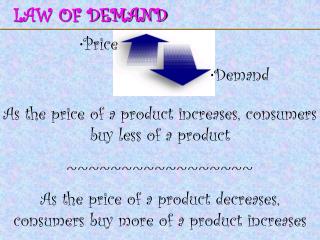
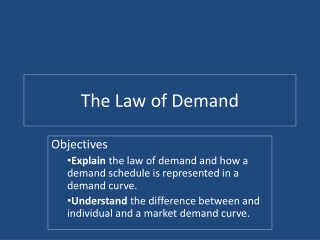
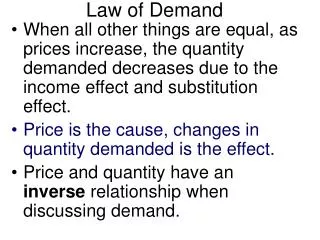
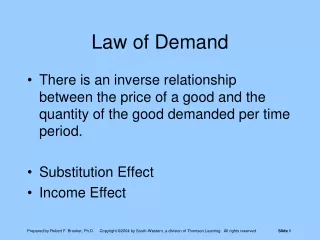
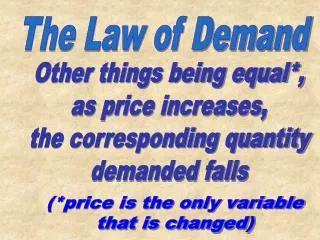
The Law of Demand Other things being equal*, as price increases, the corresponding quantity demanded falls (*price is the only variable that is changed)
The Demand Schedule Selling Quantity PriceDemanded 10 $ 5 $ 4 15 25 $ 3 $ 2 40 $ 1 60
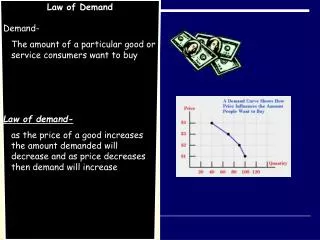
The Demand Curve Graphing: -Plot the points Price -Connect the dots $6 $5 Downsloping left to right $4 $3 Demand Demand $2 $1 0 10 20 30 40 60 50 Quantity
Market Demand The demand by all the consumers of a given good or service.
Substitution effect The change in the quantity demanded of a good that results from a change in price, making the good more or less expensive relative to other goods that are substitutes. Income effect The change in the quantity demanded of a good that results from the effect of a change in the good’s price on consumers’ purchasing power.
Changes in Demand Movement OF the curve Caused by a Change in a Determinant Selling Quantity Price Old New Inc Dec 1 $ 6 0 0 1 2 $ 5 3 $ 4 2 1 2 3 $ 3 4 3 $ 2 4 5 4 6 $ 1 5 6 $ 0 7 5
Graphing Changes Increase in Demandshifts out or to the right Price $6 $5 $4 $3 $2 $1 Old 0 1 2 3 4 6 5 Decrease in Demandshifts in or to the left Quantity
Shifting the Demand Curve Why the curve shifts 1 Consumer Incomes 2 Price of Other Goods Consumer Tastes 3 Number of Consumers 4 5 Consumer Expectations
The Determinants of Demand Or why the curve shifts 1 Consumer Incomes +tax cuts increase net incomes Consumers have more money to spend, demand increases -the $ depreciates against the Euro Imported goods from Europe cost more dollars, demand decreases For Normal Goods!!! For Normal Goods!!!
The Determinants of Demand For Inferior Goods +tax cuts increase net incomes Consumers switch to better goods, demand for Hot Dogs decreases -the $ depreciates against the Euro Domestic travel looks better, demand increases
The Determinants of Demand Price of Other Goods 2 If airlines cut ticket prices More demand for Luggage Less demand for train tickets
Tickets and Luggage are compliments Compliments are consumed or used together (inverse relationship) If ticket prices decrease, demand for Luggage increases If ticket prices increase, demand for Luggage decreases Airlines and Trains are Substitutes Substitutes replace each other (direct relationship) If air tickets increase, demand for Train tickets also increases
The Determinants of Demand Consumer Tastes 3 -beanie hats make a comeback Demand increases -Hula Hoops go out of style Demand decreases
The Determinants of Demand Number of Consumers (also Demographics) 4 -Hurricanes around Labor Day Fewer tourists touring Florida and the Gulf Coast, demand decreases More tourists touring, NC and SC, demand increases
The Determinants of Demand 5 Consumer Expectations -dealers reduce car prices in August Car buyers wait, demand decreases -heavy rains have damaged coffee crop Consumers expect shortages and higher prices so they buy more now, demand increases
Shifting the Demand Curve Why the curve shifts 1 Consumer Incomes 2 Price of Other Goods Consumer Tastes 3 Number of Consumers 4 5 Consumer Expectations
Changes in Quantity Demanded Movement ALONG the curve Consumers responding to a Change in the Price of the good Caused by factors related to production of the good Price The Supply Schedule!! $6 Harder or costlier to produce, price goes up $5 Supply Curve decrease P2 P Q $4 increase P1 Current Price $3 What makes the Supply Curve Shift?? What makes the Supply Curve Shift?? P3 $2 P Q $1 Demand Easier or less expensive to produce, price goes down Q2 Q1 Q3 Quantity 0 1 2 3 4 6 5
A Change in Demand versus a Change in Quantity Demanded Price falls from $700 to $600, then movement along the demand curve from A to B—an increase in quantity demanded from 3 million tablets to 4 million tablets. If consumers’ incomes increase, the demand curve will shift to the right—an increase in demand. In this case, the increase in demand from D1 to D2 causes the quantity of tablet computers demanded at a price of $700 to increase from 3 million tablets at point A to 5 million tablets at point C.
Changes in Quantity Demanded or Changes in Demand? Consumer Incomes rise more jewelry is purchased.
The Barber raises the price of haircuts and he loses business
Price of Toyotas goes up sales of Chevrolets increase
The Law of Supply Other things being equal*, as price increases, producers will be willing to supply more (*price is the only variable that is changed)
The Supply Schedule Selling Quantity PriceSupplied 60 $ 5 $ 4 40 25 $ 3 $ 2 15 $ 1 10
The Supply Curve Graphing: -Plot the points Price -Connect the dots $6 Upsloping right $5 to left $4 $3 Supply $2 $1 0 10 20 30 40 60 50 Quantity
Changes in Supply Movement OF the curve Caused by a Change in a Determinant Selling Quantity Supplied Price Old New Inc Dec 7 5 $ 6 6 5 6 4 $ 5 5 $ 4 4 3 2 3 $ 3 4 1 $ 2 2 3 2 $ 1 1 0
Graphing Changes Increase in Supplyshifts out or to the right Price $6 $5 $4 Old $3 $2 Decrease in Supply shifts in or to the left $1 0 1 2 3 4 6 5 Quantity
Shifting the Supply Curve Why the curve shifts Resource Prices 1 2 Changes in Technology 3 Prices of other goods 4 Number of Producers 5 Producer Expectations 6 Taxes and Subsidies
The Determinants of Supply Or why the curve shifts Resource Prices 1 -gas is discovered under CVCC Supply increases -Minimum wage goes up Supply decreases
The Determinants of Supply 2 Changes in Technology + If a more powerful computer is developed Makes production easier (and cheaper) - If stronger pollution controls are required Makes production harder (and costly)
The Determinants of Supply 3 Prices of other goods Shift resources away from high production cost goods. Caused by natural disasters or market price of other goods
The Determinants of Supply 4 Number of Producers +more firms increase supply -fewer firms decrease supply
The Determinants of Supply 5 Producer Expectations about prices and resource availability -if prices are expected to increase, more production -if prices are expected to decrease, less production
The Determinants of Supply 6 Taxes and Subsidies - taxes discourage production BONUS!! + subsidies encourage production
Changes in Quantity Supplied Movement ALONG the curve Response to a Change in the Price of the good Caused by factors related to consumers Price $6 $5 P2 $4 Supply P1 Current Price $3 P3 $2 $1 Q2 Q1 Q3 Quantity 1 2 3 4 6 5 0
Shifting the Supply Curve Why the curve shifts Resource Prices 1 2 Changes in Technology 3 Prices of other goods 4 Number of Producers 5 Producer Expectations 6 Taxes and Subsidies
A Change in Supply versus a Change in Quantity Supplied If price rises from $500 to $600, there will be movement up the supply curve from point A to point B—an increase in quantity supplied by Apple, Toshiba, Samsung, and the other firms from 5 million to 6 million tablets. If the price of an input decreases, that causes sellers to supply more of the product at every price, the supply curve will shift to the right—an increase in supply. In this case, the increase in supply from S1 to S2 causes the quantity of tablet computers supplied at a price of $600 to increase from 6 million at point B to 8 million at point C.
Changes in Quantity Supplied or Changes in Supply? Production costs decline dealer sells more cars.
Changes in Quantity Supplied or Changes in Supply? Fewer oranges offered because the price has dropped
The government doubles the excise tax on liquor Changes in Quantity Supplied or Changes in Supply?
Equilibrium Where it is possible for buyers and sellers to realize their choices simultaneously
The Demand and Supply Schedules Selling Quantity PriceDemanded Supplied 60 $ 5 10 40 $ 4 15 25 25 $ 3 $ 3 25 25 15 $ 2 40 10 $ 1 60
Together!! Graphing: -Plot Demand Price -Plot Supply $6 D S $5 $4 $3 $2 D $1 S 0 10 20 30 40 60 50 Quantity
New Equilibrium Shifting the Supply Curve Caused by a change in a Determinant of Supply Price $6 Supply $5 decrease P2 P Q $4 increase P1 Current Equilibrium $3 P3 $2 P Q $1 Demand Q2 Q1 Q3 Quantity 0 1 2 3 4 6 5
New Equilibrium Shifting the Demand Curve Caused by a change in a Determinant of Demand Price $6 $5 P Q Supply P2 $4 decrease P1 Current Equilibrium $3 P3 increase $2 P Q Demand $1 Q3 Q1 Q2 Quantity 1 2 3 4 6 5 0
Shifting the Demand Curve Why the curve shifts 1 Consumer Incomes 2 Price of Other Goods Consumer Tastes 3 Number of Consumers 4 5 Consumer Expectations
Shifting the Supply Curve Why the curve shifts Resource Prices 1 2 Changes in Technology 3 Prices of other goods 4 Number of Producers 5 Producer Expectations 6 Taxes and Subsidies
A. Decrease in Demand B. Increase in Demand C. Decrease in Supply D. Increase in Supply Consumer Incomes rise more jewelry is purchased.
A. Decrease in Demand B. Increase in Demand C. Decrease in Supply D. Increase in Supply The Barber raises the price of haircuts and he loses business
A. Decrease in Demand B. Increase in Demand C. Decrease in Supply D. Increase in Supply Production costs decline dealer sells more cars.
A. Decrease in Demand B. Increase in Demand C. Decrease in Supply D. Increase in Supply Price of Toyotas goes up sales of Chevrolets increase