Download
1 / 18
180 likes | 277 Vues
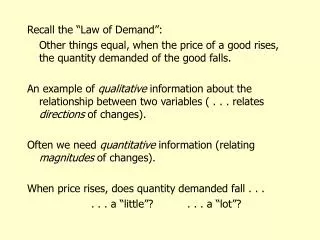
Recall the “Law of Demand”: Other things equal, when the price of a good rises, the quantity demanded of the good falls. An example of qualitative information about the relationship between two variables ( . . . relates directions of changes).

E N D
Recall the “Law of Demand”: Other things equal, when the price of a good rises, the quantity demanded of the good falls. An example of qualitative information about the relationship between two variables ( . . . relates directions of changes). Often we need quantitative information (relating magnitudes of changes). When price rises, does quantity demanded fall . . . . . . a “little”? . . . a “lot”?
p p D1 D2 p Q Q “big” Q “small” Q How can we measure the degree of responsiveness of quantity demanded to price changes? It seems to be related to slope: Relatively “flat” demand -- big response of Q to p Relatively “steep” demand -- small response.
This suggests using either the slope or the reciprocal of the slope of demand as a measure of the responsiveness of Q to changes in p. Reciprocal of the slope = “change in Q / change in p” Greater value for reciprocal of slope means quantity demanded is “more responsive” to price changes?
Problems with the use of demand curve slope (or its reciprocal) as a measure of responsiveness: 1. Numerical value has “units” attached. -- can’t compare across goods measured in different units. -- can get any numerical value you want just by changing units. 2. The slope (or its reciprocal) involves an implicit comparison (ratio) of absolute changes. -- may not be very informative.
Here’s an example to show why: At first, the demand for good A seems more responsive: a smaller price change produces a bigger quantity response. But when we think in terms of relative (rather than absolute) changes, the demand for good B is clearly more responsive than the demand for good A.
The lesson: A comparison of relative (or percentage) changes gives a more informative measure of responsiveness. (own price) elasticity of demand =
One remaining question: When quantity changes (from Q1 to Q2, say), what quantity should be used as the “base Q” in a percentage change calculation? The usual choice: the initial quantity (Q1) (A change from Q = 100 to Q = 110 is an increase of 10%, calculated by this method.)
Problem: This method gives a different (absolute) value for the percentage change going in the other direction. (A change from Q = 110 to Q = 100 is a decrease of 9.09%) Standard convention: The “Midpoint Method.” For the “base Q” use the simple average of the initial and final quantities: (Q1 + Q2) ÷ 2 (Same for percentage changes in price)
(Q2 - Q1) / (Q2 + Q1) (p2 - p1) / (p2 + p1) Earlier, we had the (own price) elasticity of demand expressed as: (Q2 - Q1) / [ (Q2 + Q1) ÷ 2] = (p2 - p1) / [ (p2 + p1) ÷ 2 ] or, more simply =
($/lb.) Pt. 2 1.75 Pt. 1 1.50 Demand 80 (lbs./day) 72 An example of an elasticity calculation: (Q2 - Q1) / (Q2 + Q1) = (p2 - p1) / (p2 + p1) (72 - 80) / (72 + 80) = = -0.684 (1.75 - 1.50) / (1.75 + 1.50)
. . or, simplifying . . A brief digression for those who know some calculus: The formula on previous slide gives “arc elasticity,” because it assigns an elasticity value to any “arc,” or segment, of a demand curve. We can write arc elasticity as: . . . where “midpoint” p and Q are the average values of p and Q over the arc.
-- the derivative of Q w.r.t. p. “Point elasticity”: Now let the arc gradually shrink to a single point. “Midpoint” p and Q become the unique price and quantity coordinates of the point . . . . . . and the ratio of discrete changes in Q and p converges to: (For the purposes of Econ 101, arc elasticity is good enough.)
Now returning to the example of an elasticity calculation: = -0.684. What do we make of this number? First note negative sign. Along a demand curve, price and quantity changes are always of opposite signs . . . . . . so (own price) elasticities of demand are always negative. Sometimes we automatically think in terms of absolute values ( . . . but this can be a dangerous habit).
Let’s look at some cases, remembering p Pt. 1 p Pt. 2 Q What information is conveyed by the numerical value ( || = 0.684 )? With vertical demand . . . %Q = 0 so = 0 “perfectly” or (“completely”) inelastic demand Exactly the same quantity demanded -- no matter what the price.
p p Q Q With “relatively steep” demand . . . | %p | > | %Q | so . . . 0 < | | < 1 “inelastic demand”
p p Q Q For certain special demand curves, the relative (%) changes in price and quantity are the same (in absolute value). | %p | = | %Q | so . . . | | = 1 “unit elastic demand”
p p 1 < | | < “elastic demand” Q Q For “relatively flat” demand curves . . . | %p | < | %Q | so . . .
p p1 | | = “perfectly” (or “completely”) elastic demand Q Q For a horizontal demand curve . . . %p = 0 so . . . At any price equal to or below p1, quantity demanded is unlimited (for practical purposes). At any price even slightly above p1, quantity demanded is zero.