Download
1 / 16
160 likes | 275 Vues
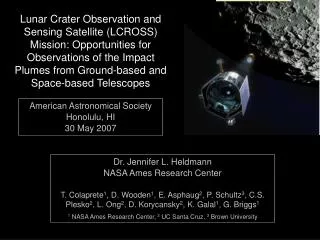
Using Realistic MHD Simulations for Modeling and Interpretation of Quiet Sun Observations with HMI/SDO. I. Kitiashvili 1,2 , S. Couvidat 2 1 NASA Ames Research Center 2 Stanford University. Helioseismic and Magnetic Imager. HMI product. Doppler shift LOS magnetic field Line width

E N D
Using Realistic MHD Simulations for Modeling and Interpretation ofQuiet Sun Observations with HMI/SDO I. Kitiashvili1,2, S. Couvidat2 1NASA Ames Research Center 2Stanford University
HMI product Doppler shift LOS magnetic field Line width Line depth Scherrer et al., 2012 Zhao et al., 2012
Outline Doppler shift LOS magnetic field r, p, T,V,B I, V, Q, U
Outline • Comparison simulation results • Investigate center-to-limb variation
‘SolarBox’ code • 3D rectangular geometry • Fully conservative compressible • Fully coupled radiation solver: • LTE using 4 opacity-distribution-function bins • Ray-tracing transport by Feautrier method • 14 ray (2 vertical, 4 horizontal, 8 slanted) angular quadrature • Non-ideal (tabular) EOS • 4th order Padé spatial derivatives • 4th order Runge-Kutta in time • LES-Eddy Simulation options (turbulence models): • Compressible Smagorinsky model • Compressible Dynamics Smagorinsky mode (Germano et a., 1991; Moin et al, 1991) • MHD subgrid models (Balarac et al., 2010) • DNS+Hyperviscosity approach • MPI parallelization (plane and pencil versions)
Simulation setup • Hydrodynamic case • MHD case • Bz0=10 G • Bz0=100 G 1 Mm 5 Mm 00 300 6.4 Mm 450 6.4 Mm 600 Spinor code A. Lagg; Frutiger et al., 2005
Correlation coefficients between the Doppler shift and the simulated plasma velocity
Correlation between the continuum intensity and temperature/density
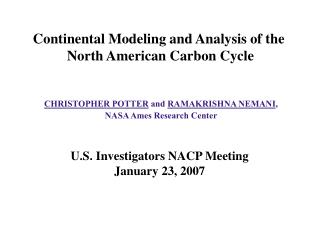
Center-to-limb variation: “convective blue-shift” To investigate the center-to-limb variation effects we averaged over the 6.4x6.4 Mm2 area the Doppler-shift velocity observed at the different viewing angles: 0 (blue), 30 (green), 45 (orange) and 60 (red) degrees. This signal corresponds to observations of radial or low-l oscillations. The results show that for the large angles the Doppler velocity becomes larger and has long-term variations in addition to the 5-min oscillations. The bottom plot shows the mean velocity for the whole interval as a function of the viewing angle. The results reproduce the well-known “convective blueshift effect” which puzzled solar astronomers in the past (e.g. Evershed, 1931). This effect is explained by the relatively large contribution of the bright upflows at the disc center. Close to the limb a large contribution comes from horizontal flows.
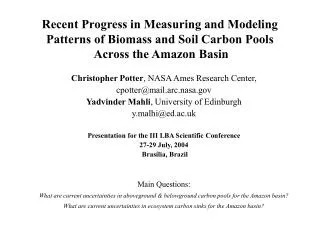
Center-to-limb variation: “shrinking-Sun effect” • By computing the running difference of the Doppler velocity we remove the long-term variations, and the signals become similar at all angles. However, the amplitude becomes lower for the simulated observations closer to the limb. • To investigate the potential time lags between the oscillations observed at the different angles we calculates the cross-correlations for the signals at 30 (green), 45 (orange) and 60 (red) degrees relative to the disk center. • Apparently, the oscillation signal at the disk center is observed by 2-3 sec earlier than the same oscillations viewed at the disk center. • This may provide the explanations of the puzzling behavior of the wave travel times measured by time-distance helioseismology (e.g. Zhao et al 2012) and the famous effect of the “shrinking or concave Sun” (Duvall, Hanasoge, 2009; Baldner, Schou, 2012).
Center-to-limb variation: “shrinking-Sun effect” • By computing the running difference of the Doppler velocity we remove the long-term variations, and the signals become similar at all angles. However, the amplitude becomes lower for the simulated observations closer to the limb. • To investigate the potential time lags between the oscillations observed at the different angles we calculates the cross-correlations for the signals at 30 (green), 45 (orange) and 60 (red) degrees relative to the disk center. • Apparently, the oscillation signal at the disk center is observed by 2-3 sec earlier than the same oscillations viewed at the disk center. • This may provide the explanations of the puzzling behavior of the wave travel times measured by time-distance helioseismology (e.g. Zhao et al 2012) and the famous effect of the “shrinking or concave Sun” (Duvall, Hanasoge, 2009; Baldner, Schou, 2012).
Conclusion • The realistic radiative MHD simulations in combination with the spectro-polarimetric radiative transfer code provide a powerful tool for modeling the HMI (Fe 6173) line profile and HMI observables for their physical interpretation and calibrations. • We have modeled the HMI observations of a quiet Sun region observed at different angles (simulating the center-to-variations) and determined the atmospheric regions sampled by the HMI observations. • Cross-correlation of the Doppler shifts between the same oscillation signal observed at different angles reproduces the helioseismology artifact -- the ‘concave Sun' effect, observed when the solar oscillation signal from the near-limb regions arrives faster than expected. This effect is stronger for the continuum intensity data, as is also found in the HMI data. Our results indicate that the systematic travel time shifts found in helioseismology analysis are caused by real physical effects in the solar photosphere. Further modeling work is need to quantify the line formation effects in helioseismology measurements. • We found a strong center-to-limb dependence of the line formation height. According to our analysis, the line is formed at a height of about 75 km above the photospheric level at the disc center, whereas at 600 from the center the formation height increases to about 200 km. • Our modeling results show that this approach based on the realistic simulations is quite perspective. The future plans are to investigate the physics of the HMI observations in more detail including other observables and also magnetic regions of various field strength. • Comparison of the mean Doppler shift for different distances from the disc center reveals a mean blue shift of about 50 – 100 m/s at the disc center, and a 100 – 210 m/s red-shift at the 600 distance. In the simulation the mean velocity value fluctuates because of the 5-min oscillations. Removing the systematic mean shifts of the Doppler velocities reveals the decreasing amplitude of the 5-min oscillation for areas closer to the limb.