Agricultural Policy
460 likes | 802 Vues
Agricultural Policy Daryll E. Ray University of Tennessee Agricultural Policy Analysis Center Third Butler/Cunningham Conference on Agriculture and Environment Embassy Suites, Montgomery, AL November 8, 2004 The Realities Crop exports did not deliver—will not deliver

Agricultural Policy
E N D
Presentation Transcript
Agricultural Policy Daryll E. Ray University of Tennessee Agricultural Policy Analysis Center Third Butler/Cunningham Conference on Agriculture and Environment Embassy Suites, Montgomery, AL November 8, 2004
The Realities • Crop exports did not deliver—will not deliver • For crop agriculture, timely free- market self-correction is a fantasy • Excess capacity is crop agriculture’s future peppered with periods of production-shortfalls • Carrying water for agribusinesses typically works against farmers’ best interests • Current farm programs are not sustainable
The Realities • Crop exports did not deliver—will not deliver • For crop agriculture, timely free- market self-correction is a fantasy • Excess capacity is crop agriculture’s future peppered with periods of production-shortfalls • Carrying water for agribusinesses typically works against farmers’ best interests • Current farm programs are not sustainable
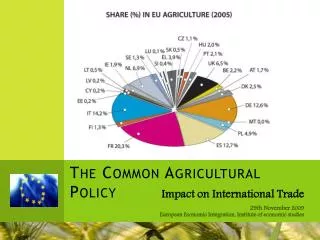
US Domestic Demand US Population US Exports Exports Did Not Deliver *Adjusted for grain exported in meat Index of US Population, US Demand for 8 Crops and US Exports* of 8 Crops 1979=1.0 • Exports down to flat for last two decades • Domestic demand increases steadily • Since 1979, exports have NOT been the driving force in US crop markets
Net Export Acreage for 8 Major Crops Million Acres 103.6 76-85 Average 86.8 86-95 Average 77.0 96-02 Average
Expectations vs. Experience Expectation:Export lead farm prosperity just around the corner (been saying this for over 25 years) Experience:Crop exports have been flat for years. Exports have not been the driving force of crop utilization
The Realities • Crop exports did not deliver—will not deliver • For crop agriculture, timely free- market self-correction is a fantasy • Excess capacity is crop agriculture’s future peppered with periods of production-shortfalls • Carrying water for agribusinesses typically works against farmers’ best interests • Current farm programs are not sustainable
Expectations vs. Experience Expectation:With no acreage set-asides and use of direct payments in US, competitors would not be under the US price support umbrella—as a result they would reduce production as needed
Expectations vs. Experience Expectation:With no acreage set-asides and use of direct payments in US, competitors would not be under the US price support umbrella—as a result they would reduce production as needed Experience: • Export competitors export all production above domestic demand • Eliminating set-asides and lower commodity prices did not cause competitors to reduce acreage
Expectations vs. Experience Expectation: With planting flexibility & decoupled payments US farmers would plant for the market – reduce production when needed Experience: • Farmers change the mix of crops but use all their acreage • Farmers have every incentive to produce full out • Land remains in production even if the current farmer goes bankrupt
Acreage Response toLower Prices? Four Crop Acreage Four Crop Price Adjusted for Coupled and Decoupled Payments Index (1996=100) Four Crop Price Adjusted for Coupled Payments Four Crop Price Since 1996 • Aggregate US corn, wheat, soybean, and cotton acreage changed little • While “prices” (take your pick) dropped by 40, 30 or 22%
Acreage Response toLower Prices? Four Crop Acreage Index (1996=100) Four Crop Price Since 1996 “Freedom to Farm” • Aggregate US corn, wheat, soybean, and cotton acreage changed little despite a wide fluctuation in price
Canada: Farmland Planted Other Oilseeds Other Grains Canola Million Acres Barley Wheat • Canada reduced subsidies in 1990s • Eliminated grain transportation subsidies in 1995 • Crop mix changed, total acreage remained flat
Australia: Farmland Planted Oilseeds Coarse Grains Million Acres Wheat • Australia dramatically reduced wool subsidies in 1991 • Acreage shifted from pasture to crops • All the while, prices declined
Expectations vs. Experience Expectation: With planting flexibility & decoupled payments US farmers would plant for the market – reduce production when needed Experience: • Farmers change the mix of crops but use all their acreage • Farmers have every incentive to produce full out • Land remains in production even if the current farmer goes bankrupt
Why Does Agriculture Have Chronic Price and Income Problems? • Technology expands output faster than population and exports expand demand • Market failure: lower prices do not solve the problem • Little self-correction on the demand side • People will pay almost anything when food is short • Low prices do not induce people to eat more • Little self-correction on the supply side • Farmers tend to produce on all their acreage • Few alternate uses for most cropland
The Realities • Crop exports did not deliver—will not deliver • For crop agriculture, timely free- market self-correction is a fantasy • Excess capacity is crop agriculture’s future peppered with periods of production-shortfalls • Carrying water for agribusinesses typically works against farmers’ best interests • Current farm programs are not sustainable
Worldwide Excess Capacity Will Be The Long-run Problem • Dramatic yield increases in other countries • Cargill, Monsanto, John Deere, etc., etc., etc. • Acreage once in production will be brought back in • Russia, Ukraine and others • New Acreage • Brazil • China
The Realities • Crop exports did not deliver—will not deliver • For crop agriculture, timely free- market self-correction is a fantasy • Excess capacity is crop agriculture’s future peppered with periods of production-shortfalls • Carrying water for agribusinesses typically works against farmers’ best interests • Current farm programs are not sustainable
What Agribusinesses Want • Volume(paid flat per bushel rate) • Low Prices(low cost of ingredients) • Price instability(superior information systems provide profit opportunities) • Reduced regulation of production and marketing practices(seller-to and buyer-from beware) • More market power over competitors and their customers/suppliers(Want everyone at a competitive disadvantage)
The Realities • Crop exports did not deliver—will not deliver • For crop agriculture, timely free- market self-correction is a fantasy • Excess capacity is crop agriculture’s future peppered with periods of production-shortfalls • Carrying water for agribusinesses typically works against farmers’ best interests • Current farm programs are not sustainable
We Can’t Go On Like This… • The current farm programs are too expensive • Budget boogeyman • $422 billion current-year deficit—$5 trillion over 10 years: Cuts in Farm Programs are almost certain • GAO report is likely to curtail Payment-Limitation-“Winking” • WTO ruling may put LDPs and Counter-Cyclical Payments in jeopardy • Would Remove the ability to compensate for low prices even less than in 1996 FB
If Not SustainableThen What? • Must be a mindset change • Producers and farm and commodity organizations must refuse to carry water • Must design policies based on “the realities” not hope or wishful thinking • Must be willing to energetically embrace other groups that genuinely share identical or complementary objectives • Work as hard to become independent as they have “worked” to become subservient in the past
If Not SustainableThen What? • Did I mention that there must be a mindset change? • Everything should be on the table. Take nothing for granted. • Previous programs: DNA testing (seeing what happens when most of them are eliminated) have exonerated most of the “failed programs of the past” • In all cases, do not contradict or ignore any of “the realities” when developing policy
If Not SustainableThen What? • Create a fresh, bold policy vision that catches people’s imagination and is farmer-centered • I think the time is right for a merging of agricultural and energy policy • Energy could/should be the next soybeans • Formerly 30-50 percent of land was dedicated to energy production (horse feed, wood fuel, etc.) • More than ethanol and biodiesel
Merge Ag and Energy Policy • Biofuels recycle atmospheric, not fossil, carbon • Look at crops not in food equation & NOT internationally traded • Switchgrass (as an illustrative example only) • Perennial • Reduced inputs • Multi-year setaside • Burned in boilers for electricity • Converted to ethanol • Less costly than present ag programs
The Realities(just in case you missed them) • Crop exports did not deliver—will not deliver • For crop agriculture, timely free- market self-correction is a fantasy • Excess capacity is crop agriculture’s future peppered with periods of production-shortfalls • Carrying water for agribusinesses typically works against farmers’ best interests • Current farm programs are not sustainable
The Vision Thing • Policy vision MUST be premised on realities • Seize the moment—may be one of those rare opportunities for fundamental change • A possibility: Coalesce agricultural and energy interests to shape a Win, Win, Win Comprehensive Agricultural/Energy Policy
Weekly Policy Column To receive an electronic version of our weekly ag policy column send an email to: dray@utk.edu requesting to be added to APAC’s Policy Pennings listserv
Comparative Advantage Theory vs. Realities of the Real World “China attaches great importance to agricultural development and increasing the income of farmers.” “It is inconceivable that a country of 1.3 billion people will rely on others to feed themselves,” Zhou Ming Chen, Chairman of the China National Cereals Oils and Foodstuffs Import and Export Corp. Washington D.C.February 17, 2004
"Faced with the choice of changing one's mind and proving one doesn't need to do so, ... we get busy on the proof."John Kenneth Galbraith
China Net Corn TradeComparison between 1996 and 1999 FAPRI projections and PS&D actual Mil. Bu. 1996 FAPRI Projections of Net Corn Trade Corn Imports 1999 FAPRI Projections of Net Corn Trade Corn Exports PS&D Actual Net Corn Trade with 2003 Projection
Corn Baseline ProjectionsU.S. Exports Mil. Bu. FAPRI 12-1995 Projection 1979 Record 2,402 Mil. Bu CBO 4-2001 Projection Actual Flat Export Projection
U.S. Domestic and Export Demand Corn Million Bu. DOMESTIC 1976-85Average: 4,909 1996-02Average:7,537 1986-95Average: 6,188 20% EXPORTED 1996-02Average: 1,868 28% EXPORTED 1976-85Average: 1,923 1986-95Average: 1,831 EXPORT Source: USDA PS&D Database
U.S. Net Domestic & Net Export Corn Demand Adjusted for corn fed to import and export beef, pork, and broilers Million Bu. DOMESTIC 1976-85Average: 4,935 1996-02Average:7,281 1986-95Average: 6,156 23% EXPORTED 1996-02Average: 2,125 28% EXPORTED 1976-85Average: 1,897 1986-95Average: 1,863 EXPORT Source: USDA PS&D Database
U.S. Net Domestic & Net Export Corn Demand With and without net livestock export adjustment Million Bu. Published Domestic Demand DOMESTIC Domestic Demand with net livestock export adjustment Export Demand with net livestock export adjustment Published Export Demand EXPORT Source: USDA PS&D Database
Expectations vs. Experience Expectation: International trade and market response/privately-held stocks will perform price stabilizing function Experience: Export markets respond too little to price to rebalance inventories Privately-Held Stocks • Are always “On the Market” so takes less stock to drive down prices • No incentive to hold sufficient stocks to cover a true “low yield” year
We Can’t Go On Like This… • Continued WTO negotiations that further neuter ability to set domestic farm policy in this and other countries • What is good for General Motors (agribusiness)… syndrome • The whole WTO process shows a complete lack of understanding of the unique characteristics of food and agriculture • It is a clear case of not understanding that, as important as economics is, it can be trumped by food security and other social objectives in the case of food and agriculture
The Question is: What Are We Going to Do About It? • One alternative is passively sit by, be co-opted, and let others commandeer the policy agenda • That is exactly what producers have increasingly done since the mid-eighties!!! • Crop producers get subsidy-tarred while real subsidy beneficiaries (integrated livestock producers and other users, sellers of inputs and marketers of output) remain above the fray • Advocating unfettered free markets, promising export growth, or claiming a level playing field as farmers’ magic bullet, etc., ain’t workin. • And, given the realities of agriculture discussed so far, they hold little promise for the future.