Common Agricultural Policy
Common Agricultural Policy. Jan Fidrmuc Brunel University . CAP. CAP started as simple price support policy in 1962. Motivation: to support rural areas and farmers and to ensure European countries produced enough food locally

Common Agricultural Policy
E N D
Presentation Transcript
Common Agricultural Policy Jan Fidrmuc Brunel University
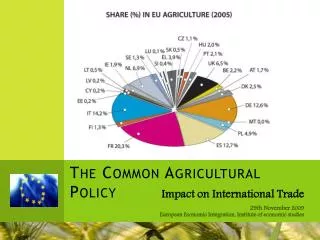
CAP • CAP started as simple price support policy in 1962. • Motivation: to support rural areas and farmers and to ensure European countries produced enough food locally • EU was net importer of food so it could support prices by imposing a tariff (‘variable levy’). • At present, CAP accounts for close to 1/2 of EU budget • EU now is net exporter of agricultural products and most CAP expenditure is on subsidies to farmers
Simple price support with tariff Home Demand Home Demand Home Supply Home Supply price price pss Price floor (Pw+T, or Pw’+T’) Price floor T’ T A B Pw’ C1 C2 Pw Pw Imports (with floor) Q Q Z Zf Cf C Z Zf Cf C Imports (without price floor)
Welfare Effects Home Demand Home Supply price • Consumer surplus falls by A+ C1+C2+B • Producer surplus rises by A • In addition, the EU as a whole gains tariff revenue (not shown here) Price floor A B C1 C2 Pw Q Z Zf Cf C
Distributional Implications price price price Family farm supply curve Commercial farm supply curve Total supply curve Pw+T Atotal Asmall Abig Pw B Q Q Zsmall Q Zbig Ztotal • Large and more efficient farms tend to gain more from CAP than small inefficient farms • Most of the gains accrue to those who are already rich
Farm size distribution in 1987 • Very skewed ownership: • Biggest 7% of farmers owned ½ of the land. • Smallest 50% of farmers owned only 7% of the land.
CAP Problems: Supply • ‘Green revolution’: technological improvements in agriculture • Agricultural output increased rapidly, faster than consumption • EU went from being a net importer of agricultural products to producing more than in needed • Solution 1: EU buys surplus output and ‘stores’ it • Solution 2: Surplus output is exported; this requires subsidies since the EU price floor exceeds the world price dumping
Home Demand Home Supply price price S1 S3 S2 S4 p1ss p2ss Price floor p3ss B S’ A Price floor a e c b d C2 C1 Pw p4ss EU purchase Home Demand Q Q Cf Zf
CAP Problems: Oversupply • EU switches from being net importer to net exporter in most agricultural products.
CAP Problems: World market impact • EU is a major food buyer. • World MD shifts in (EU does not import food) • Some of EU surplus output is dumped on world market: world MS shifts out • CAP protection and dumping depresses prices on world markets. • This harms non-EU food exporters/producers.
CAP Problems: Budget • Buying and storing or dumping food increasingly expensive. • EU no longer imports agricultural products no tariff revenue.
Other CAP Problems • Most of money goes to big farms • Small farmers continue to exit farming (see graph) • Nostalgia: family farms disappear • Pollution • Animal welfare
Solution: Decoupling • Subsidies paid regardless of production • World price allowed to prevail: supply falls and consumption rises • Welfare effect • Consumers gain: a+b • Farmers lose: -(a+b+c) • Budgetary savings: b+c+d • Net effect: b+d • Oversupply eliminated • Farmers may need to be compensated for their losses
Solution: Decoupling EU demand EU supply, S1 price surplus World Price + T Price Floor c a b d World Price EU demand Q Z Z’
CAP Reforms • Supply control attempts: • 1980s, experimentation with ad hoc supply ‘controls’ to discourage production. • Generally failed; technological progress & high guaranteed prices overwhelmed supply controls. • 1992: MacSharry Reforms: • Basic idea: CUT PRICES to near world-price level & COMPENSATE farmers with direct payments. • Worked well. • June 2003 Reforms • Implementation 2004-2007. • Similar to MacSharry reforms in spirit.
CAP Today • Two pillar structure: • Direct payments and price support • Rural Development • 2007-2013: increasing role of second pillar • Single Payment Scheme • Based on historical payments in EU15 • Money per hectare in new member states with amount limited by national ceilings • Areas covered by second pillar: • Quality incentives and support to meet standards and covering of animal welfare cost, technical advice • Improving agricultural competitiveness, sustainable land management, improving quality of life in rural areas
Farm incomes & CAP inequity • Reformed CAP support still goes mostly to big farmers. • payments intended to compensate, so inequity continued. • Half the payments to 5% of farms (the largest). • Half the farms (smallest) get only 4% of payments. • Recent studies show that only about half of these payments go to farmers. • Rest to non-farming landowners and suppliers of agricultural inputs (seed, fertilisers, agri-chemicals, etc.) • See: “Who Finances the Queen’s CAP payments?” • http://shop.ceps.be/BookDetail.php?item_id=1285