Download
1 / 32
370 likes | 1.31k Vues
University of Idaho. Fish Nutrition Research Differences and similarities with livestock nutrition and what the future holds. Part I. Ronald W. Hardy, Director Aquaculture Research Institute University of Idaho. Differences between fish and livestock Brief history of fish nutrition

E N D
University of Idaho Fish Nutrition ResearchDifferences and similarities with livestock nutrition and what the future holds. Part I. Ronald W. Hardy, Director Aquaculture Research Institute University of Idaho
Differences between fish and livestock Brief history of fish nutrition Brief overview of evolution of fish feed manufacturing Today’s hot topics in fish nutrition Replacement of marine protein and oils Effects of nutrition on food quality and fish health Microparticulate feeds for small fish larvae at first feeding Opportunities presented by developments in molecular biology Topics to cover
Fish evolved in a very diverse environment, and 20,000 species exploit every possible niche Currently, there are ~140 species fish being farmed First publication on fish farming was 2500 BC In 2005, 43% of all fish consumed globally was produced by farming Aquaculture production growing at 9-10% annually, fastest sector of animal production Fish Facts
Marine, brackish and freshwater fish Differences in osmotic cost to maintain homeostasis Coldwater and warmwater fish O2 content in water, plus availability of natural food in ponds compared trout raceways or marine net-pens metabolic rate and temperature tolerances membrane fluidity that influences fatty acid requirements Fish and crustaceans (shrimp, crabs) Huge differences in mechanisms of locating feed Shrimp are external masticators, fish gulp feed Differences in digestive physiology Feeds must be water-stable for slow eaters like shrimp Differences among farmed fish species
Major differences associated with aquatic existence Fish maintain neutral buoyancy and do not need skeletal and muscular systems to oppose gravity Fish excrete ammonia Fish are cold-blooded Other differences Fish exhibit indeterminate growth Huge differences in digestive system among farmed fish Fish are monogastric, but… Gastric stomached fish (carnivores like salmon/trout) Agastric (carp) Fish vs. livestock and poultry
Fish exist in neutral gravity, no need for heavy skeleton Dietary calcium and phosphorus needs are lower Energy expenditures for locomotion are lower Fish excrete ammonia via the gills Lower metabolic cost than excreting urea or uric acid Higher caloric energy yield from metabolism of amino acids Fish are cold-blooded Upside: no need to stay warm Downside: rates of metabolism, digestion, etc. decrease in cooler water, plus membrane fluidity must change Fish vs. livestock and poultry:differences associated with aquatic existence
Many fish exhibit indeterminate growth Growth continues after first maturation and spawning Hypertrophy and hyperplasia (make new muscle cells) Fish are monogastric (few herbivorous fish) Some fish have an acid stomach Other start with an acid stomach, then lose it as fingerlings Some are stomach-less (agastric) Fish vs. livestock and poultry:differences in physiology
Some fish spawn large eggs Salmon & trout (2000-15,000 eggs/female) Incubation requires 50-100 days depending on water temperature First feeding fry are 200-400 mg and can be fed small, particulate feed Many fish spawn very small eggs Most marine species (> 1 million small eggs per female) Incubation requires 3-7 days First feeding fry are very small and must be fed live-feed through metamorphosis or until reach a decent size It is very challenging to provide adequate nutrition via live feed Right live feed at the right time Correct nutritional content of live prey ( need PUFA enrichment) Fish vs. livestock and poultry:differences at start of exogenous feeding
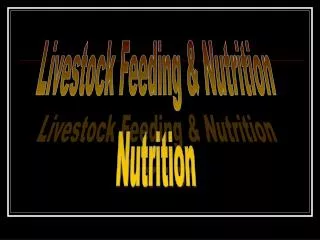
Canary rockfish larvae with feed in gutsix weeks after first feeding stage
Fish nutritional requirements Ascorbic acid Polyunsaturated fatty acids (PUFAs) Many minerals obtained via the water Carnivorous species have a limited ability to utilize or metabolize starch They evolved using protein and lipid for metabolic energy Fish vs. livestock and poultry:other nutritional differences
FCR values less than 1.0 for fish FCR values 1.6-1.8 for chickens FCR values 8-10 for cattle Yield of high-quality protein from salmonids is 55% Total yield from poultry or cattle is lower and quality varies with cut Efficiency of fish compared to livestock
Prior to 1950s: empirical feed formulation research with a variety of ingredients Nutritional diseases quite prevalent Little solid information on nutritional requirements 1950s and 60s: “Golden age” due to development of semi-purified diet that allowed single nutrients to be deleted and added back (Halver’s PhD work) Vitamin and amino acid requirements of salmon and trout were discovered Common nutritional diseases eliminated Brief history of fish nutrition
1970s : Essential nutrient list expanded to other species Refinement of nutrient requirement estimates using new approaches to assess nutritional adequacy 1980s and 90s: Aquaculture production takes off Need for economical and efficient grow-out feeds New species including those with larval stages Low-pollution feeds (low-phosphorus, highly digestible) 2000 until now Main story is alternative protein and lipid sources Sub-plot is supplements to enhance disease resistance, provide “semi-essential nutrients” and to produce healthful products (low in POPs, high in omega-3 fatty acids) Brief history of fish nutrition
Development of semi-purified diet (1953) that supported normal growth Establishment of quantitative dietary requirements of vitamins & amino acids (1960s) USFWS Western Fish Nutrition Laboratory John Halver & colleagues Pacific salmon were focus, hatchery support all work was conducted with fry & fingerlings Dietary nutrient requirements:Pioneering fish nutrition research
Vitamin Salmon/trout Chickens Vitamin A 2500 1500Vitamin D 2400 200Vitamin E 50 16Vitamin K unknown 0.5 Thiamin 1 1.3 Riboflavin 7 3.6 Pyridoxine 6 3.0 Pantothenic acid 20 10 Niacin 10 11 Biotin 0.15 0.10Folic acid 2 0.25 Vitamin B12 0.01 0.003 Ascorbic acid 50 not required Choline 800 500myo-Inositol 300 not required *values in yellow are lower for chickens Vitamin requirements of salmon and growing chickens (IU or mg/kg dry diet)
Ingredient Percent in diet Vitamin-free casein 40.0 Gelatin 8.0 Dextrin 10.0 Wheat starch 10.0 Carboxymethylcellulose 1.3 Alpha-cellulose 6.0 Mineral mixture 4.0 Vitamin mixture 3.0 Amino acid mixture 2.0 Choline chloride (70% liquid) 0.3 Herring oil 17.0 Semi-purified diet for salmonids Proximate category Percent Moisture 28-30 Crude protein 34 Fat 17 Ash 5
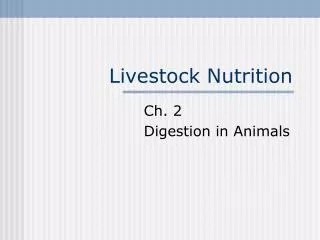
Feed semi-purified diet, adding back graded levels of single essential nutrient measure response variables growth, feed conversion ratio, survival (1950’s) tissue nutrient levels, assuming that they plateau at requirement level (1950’s through today) measure activity of enzymes that require essential nutrient as co-factor (same assumption, 1980’s) measure excretion of nutrient or metabolites (1990’s) Nutrigenomics (study of effects of nutrients on gene expression and single gene products in tissues) Determining nutrient requirements in fish
Relationship between thiamin intake and liver thiamin concentration
Protein Ten essential amino acids Lipids Omega-3 fatty acids (1% of diet) Energy Supplied mainly from lipids and protein Vitamins 15 essential vitamins Minerals 10 minerals shown to be essential Carotenoid Needed for viable eggs pigments NOTE: Other minerals are probably essential but can be obtained from rearing water Nutrient requirements of salmonids
Response variable absence of deficiency sign (minimum level) tissue saturation or plasma level enzyme activity Statistical evaluation broken-line (Almquist plot) curve-fitting and models fit curves but are they biologically relevant? do we chose 95% or 100% response as requirement? Real-world environmental conditions crowding, water quality, pathogen load etc. Criteria or method used to establish a dietary vitamin requirement affects value
Requirement* Comments 15-20 ppm Prevents deficiency signs 250-500 ppm Supports maximum wound healing activity 1000-2500 ppm Supports maximum disease resistance in laboratory challenges >2500 ppm Maximum tissue storage levels and max. immune response * When included in purified diet, with ideal conditions and no oxidation of vitamin C Ascorbic acid requirements of salmonids
Macrominerals (g/kg diet) Microminerals (mg/kg diet) (trace elements) Calcium Iron Phosphorus* Manganese* Sodium Copper Potassium* Zinc* Chlorine Cobalt Magnesium* Selenium* Sulfur Iodine* Molybdenum * Required in the diet, but not always supplemented in practical feeds Mineral requirements of fish
Synthesized products Carophyll red Carophyll pink Natural products Krill meal Phaffia yeast Marine algae Crustacean waste (crab, shrimp, crayfish) Note: astaxanthin shown to be essential nutrient for salmon to produce viable offspring Carotenoid pigments in farmed salmon and trout feeds
Complete estimates of nutrient requirements only done for juvenile Pacific salmon and rainbow trout Halver’s work never duplicated for Atlantic salmon Dietary requirements still based on Pacific salmon work Atlantic salmon production >1,200,000 metric tons ~2,000,000 metric tons of salmon and trout feed per year The nutritional information upon which this industry is based is that of Halver and his colleagues Nutrient requirements – Halver’s contribution