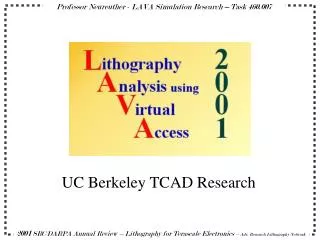
UC Berkeley TCAD Research
UC Berkeley TCAD Research. UC Berkeley LAVA Team with Professor Andy Neureuther. 1997/98 – Website development and basic infrastructure 1999/00 – Application applets targeted toward education and demonstration

UC Berkeley TCAD Research
E N D
Presentation Transcript
UC Berkeley LAVA Team with Professor Andy Neureuther • 1997/98 – Website development and basic infrastructure • 1999/00 – Application applets targeted toward education and demonstration • 2000/01 – Interactions between different simulators, parallel processing, and application applets targeted toward research and demonstration • LAVA website: cuervo.eecs.berkeley.edu/Volcano SRC website: lithonet.eecs.berkeley.edu/mc460review.html
Probe-Based Aberration Target Applet View Selected Target Line intensity plot with and/or without aberrations,as well as 2D contour output available • Major Enhancements: • Enable Zernike Aberrations • Demonstration of research targets
Aberration Target Tolerances Line Intensity Plot Java Interactive Applet Contour Plot The sensitivity of probe-based aberration targets to design dimensions and mask making tolerances can be assessed
Phase-Shifting Mask Edge Effects in Imaging Tempest/Splat Applet Interface Tempest Jpeg Output Splat Line Intensity Output + The Fourier coefficients of the near fields from TEMPEST are automatically linked to SPLAT for assessing of mask edge effects on imaging.
STORM Simulation & Java Plotter Target Image Intensity Data (SPLAT output) +Post Exposure Bake Parameter File Java PlotterOutputs Acid and Deprotection Data(STORM output) STORM Java Plotter
LAVA User Statistics – Spring 2001 14,000 requests/month SPLAT – 1246 times SAMPLE-2D – 576 timesSAMPLE-3D – 462 times Top 20 Visiting Organizations Visits by Organization Types
Simulators • SPLAT–Simulation of Profile and Lithography Analysis Topography simulates 2-dimensional projection-printing with partial coherence based on Hopkin’s theory of partially coherent imaging • SAMPLE –Simulation And Modeling of Profiles in Lithography Etching simulates time evolution of topographical features of IC devices during multiple process steps • TEMPEST–Time-domain Electromagnetic Massively Parallel Evaluation ofScattering from Topography • STORM–Simulator Tool Of Resist Modeling including reaction, diffusion and shrinkage of chemically-amplified and silylation processes • SIMPL–SIMulations of Profiles from the Layout generates cross-sections of IC chips given a fabrication process
Simulation Process Client Server CGIRequest Java Script Form or Java Applet CGIusingPERL Simulator CGIResponse Post-Process Java Plotterembedded in HTML
Millennium TEMPEST/E-Beam Projects LAVA Server Main Idea:Some simulation, such as TEMPESTand E-Beam, are time and resource intensive. By exploiting the idea of parallel processing, we can cut downthe simulation time by a factor of 1/(num of computers) in theory. Millennium network consists of 50+computer cluster for parallel processing Main obstacles:Cross platform simulationMultiple operating systemsSyncronization Java Applet Communcation Simulator Millennium