Download
1 / 36
360 likes | 491 Vues
The Economics and Politics of U.S. Agricultural Policy . James Dunn Pennsylvania State University. Since 1990, 17% of political contributions from agriculture have come from sugar growers. Sugar is less than 1% of agricultural output. Impact of technological change in agriculture. History.

E N D
The Economics and Politics of U.S. Agricultural Policy James Dunn Pennsylvania State University
Since 1990, 17% of political contributions from agriculture have come from sugar growers. Sugar is less than 1% of agricultural output
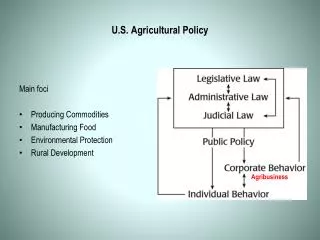
History • Started in 1930s as temporary measure • Political support remained after depression • Farm problems recur regularly • Lots of programs – I’ll talk about price and income programs
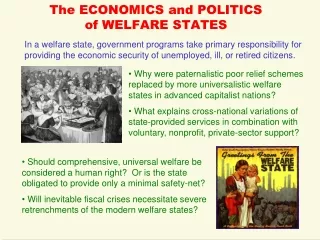
Economics of Agricultural Policy • Idea- raise farm incomes, end farm failures • Give one time boost • Doesn’t work in long run • Doesn’t stop farm exit • Subsidize large farms more • Subsidize rich at expense of others -average farm family has higher income and much higher wealth than the average US household
Types of Policies • Simple price supports – create surplus that must be purchased and sold at loss – usually exported - expensive • Quotas – limit production – make it difficult to expand – quota gains value if sold
Price support Government purchases
Purchases • What do you do with the surplus you buy? • If you give it away what about the farmers trying to compete with free food?
Capitalization of Programs • Farmers learn program will continue • Price of land and cows and other specialized assets reflects value to best farmers • Artificially high milk prices drive up prices of cows • worst farmers still lose money
Dairy Cows • If milk price is high, what happens to price of cows? • Who will pay the most? • Do higher cost farmers make any money?
Rentable Quota • Who will pay the most to rent the quota? • How much will they pay? • Who will pay the least rent? • How much will they pay? • Who makes money? • Quota in Canada is $20,000/cow
Loss of markets • Price supports reduce competitiveness in international markets, e.g., loss of soybean exports to Brazilian producers • Higher prices stimulate substitution by other commodities in consumption, e.g., high fructose corn syrup (sugar)
Some important points • Very few farmers • House of Representatives based on population – disproportionately urban • Senate – two members per state – more rural interests represented • Often control of Congress very close • in 2008 • Senate 49-49-2 (independents caucus w/ Dems) • House 232 -200 (3 vacant)
Congress Now • Senate – • 54 Democrats • 4 • 6 Republicans • House of Representatives • 232 Republicans • 200 Democrats • 3 vacant
Other Points • Farmers vote together • In a close election farm vote can be very important • No one wants to tell farmers no
The Coalition • Farmers • Consumers • Environmentalists • Other food sector participants, e.g., fertilizer companies, other agribusiness
2013 Senate Ag Committeewhite Democrat, blue Republican, white both
Program Commodities • Feed grains – mostly corn • Oil seeds – mostly soybeans • Wheat • Cotton, rice, sugar, peanuts • Dairy products • Wool, mohair, honey, dry peas • 13% of Farm Bill spending
Bio-Fuels • Subsidies for corn from ethanol • Loans for bio-refineries • Corn and soybean prices are very high • Vegetable oil prices very high • Very little savings in petroleum use
Geographic distribution of government payments as a proportion of gross cash income from farming Source:USDA Source: USDA
Policy and GATT • Small countries walked out in Cancun.
Policy and freer trade • Free trade agreement with Australia (January 1, 2005) • Duties on most industrial goods eliminated • Special treatment for agriculture, especially sugar and dairy products • Central American Free Trade Agreement was held up over agriculture (sugar) but passed in 2005 • NAFTA disputes - many over agriculture (tomatoes, sugar)
Concluding Comments • Not a big success • Very costly • Extremely important politically – domestically and internationally • With close elections – won’t go away –very important in government shutdown