Understanding Sinusoidal Graphs: Sine and Cosine Functions
This lesson covers the fundamental concepts of sinusoidal graphs, focusing on the sine and cosine functions. We will explore the properties of sinusoidal curves, including period and amplitude, with specific examples. The general sine and cosine curves will be detailed, showing how to reflect them based on the coefficient of the amplitude. Examples will be provided for clarity, including graphs of y = 3sin(x) and y = sin(2x). Homework will help reinforce these concepts, including exercises on pages 452 and additional problems to practice.

Understanding Sinusoidal Graphs: Sine and Cosine Functions
E N D
Presentation Transcript
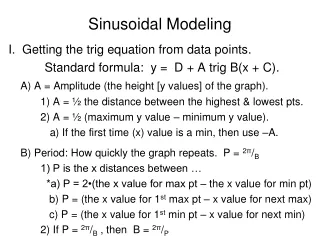
Graph of y = sinx x y 1 –1 Period = 2𝝅 Amplitude = max – min = 1 – – 1 = 1 2 2
General Sine Curve We’ll do c & d tomorrow If a is (+), typical sine curve If a is (–), reflect through x-axis
Ex 1) Graph y = 3sinx b c a d = 1 = 0 = 3 = 0 3 –3 Amp = 3 Period = 2𝝅 Increment length
Ex 2) Graph y = sin2x b c a d = 2 = 0 = 1 = 0 1 –1 Amp = 1 Per: IL:
Graph of y = cosx x y 1 –1 Period = 2𝝅 Amplitude = max – min = 1 – – 1 = 1 2 2
General Cosine Curve We’ll do c & d tomorrow If a is (+), typical cosine curve If a is (–), reflect through x-axis
Ex 3) Graph b c a d = = 0 = –2 = 0 2 –2 Amp = 2 Per: IL: a = –2 reflect across x-axis
Homework #720 Pg. 452 1 – 4 all, 13 – 20 all