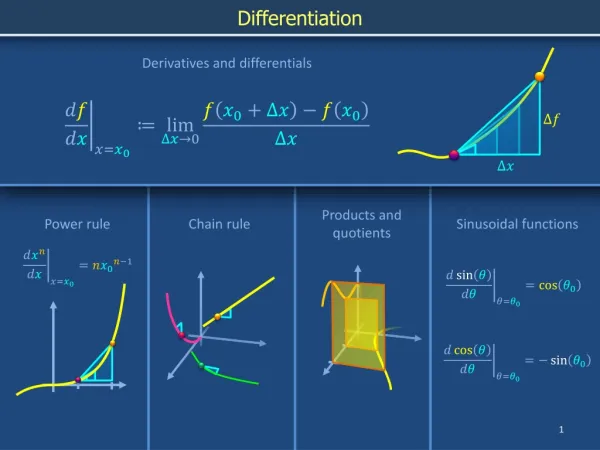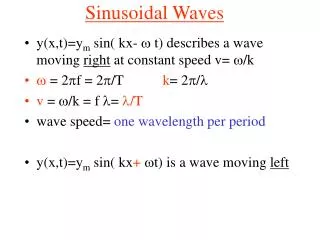
Sinusoidal Functions
Sinusoidal Functions. Sinusoidal Functions. The parent function y = sin( x ) can be transformed using four parameters. Each parameter describes a certain characteristic of the graph . y = A sin [ B ( x – C )] + D. y = A sin [ B ( x – C )] + D.

Sinusoidal Functions
E N D
Presentation Transcript
Sinusoidal Functions The parent function y = sin(x) can be transformed using four parameters. Each parameter describes a certain characteristic of the graph. y = Asin[B(x – C)] + D
y = Asin[B(x – C)] + D • A represents the amplitude of the graph. The amplitude is the vertical distance from the horizontal axis of the graph to the maximum value or the minimum value of the graph. • The amplitude is also equal to half of the difference between the maximum and minimum values.
y = Asin[B(x – C)] + D • B represents the angular frequency of the graph. The angular frequency describes how many crests or troughs of the graph are present within a 360°or 2π portion of the domain of the graph. • The angular frequency is also found by dividing 2π by the period, which is the horizontal distance between two consecutive maximum or minimum values.
y = Asin[B(x – C)] + D • C represents the phase shift, or horizontal translation of a sine function. • D represents a vertical translation of the graph. • The line y = D is the equation of the sinusoidal axis, which is the horizontal line representing the distance that is midway between the crests and troughs of the graph.