Download
1 / 12
120 likes | 250 Vues
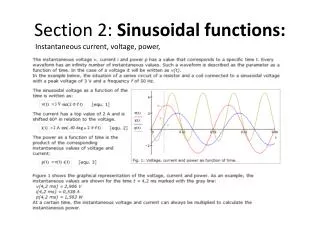
This review covers the fundamental characteristics of sinusoidal functions: sine, cosine, and tangent. Explore the features such as amplitude, period, and key points within one cycle for each function. Familiarize yourself with transformations, including vertical and horizontal shifts, dilations, and reflections. Through practical explorations with graphing tools, you'll analyze how different transformations affect the appearance of these functions. Additionally, practice problems will reinforce your understanding of features such as amplitude, period, equilibrium axis, and phase shifts.

E N D
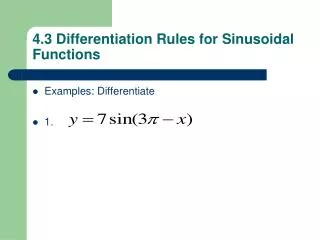
TF.03.3a - Transforming Sinusoidal Functions MCR3U - Santowski
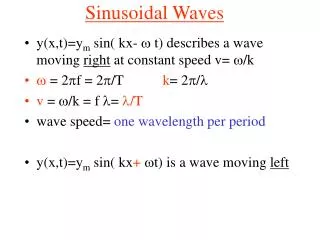
(A) Review y = sin(x) • Recall the appearance and features of y = sin(x) • The amplitude is 1 unit • The period is 2 rad. • The equilibrium axis is at y = 0 • One cycle begins at (0,0), on the equilibrium axis and rises up to its maximum • The five keys points on the sin function are (0,0), (/2,1), (,0), (3/2,-1) and (2,0)
(A) Review y = cos(x) • Recall the appearance and features of y = cos(x) • The amplitude is 1 unit • The period is 2 rad. • The equilibrium axis is at y = 0 • One cycle begins at (0,1), at the maximum and decreases to the equilibrium axis and the minimum • The five keys points on the cos function are (0,1), (/2,0), (,-1), (3/2,0) and (2,1)
(A) Review y = tan(x) • Recall the appearance and features of y = tan(x) • There is no amplitude as the curve rises along the asymptotes • The period is rad. • The equilibrium axis is at y = 0 • One cycle begins at x = -/2 where we have an asymptote, rises to the x-intercept and then rise along the asymptote at x = /2 • The five keys points on the tan function are (-/2,undef), (-/4,-1), (0,0), (/4,1) and (/2,undef)
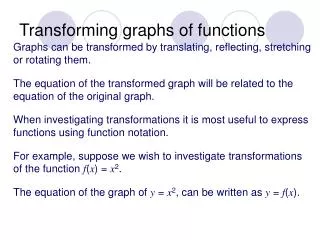
(B) Review - Transformations • Recall our work with transforming functions and the various notations that communicate the different types of transformations. • If y = f(x) is our “standard, base” function, then: • f(x) + a is a vertical translation up • f(x) – a is a vertical translation down • f(x-a) is a horizontal translation to the right • f(x+a) is horizontal translation to the left • af(x) is a vertical dilation by a factor of a • f(ax) is a horizontal dilation by a factor of 1/a • -f(x) is a reflection in the x axis • f(-x) is a reflection in the y-axis
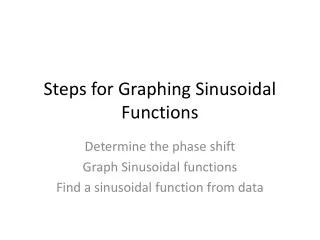
(C) Transformations - Investigation • Open up WINPLOT and a WORD document copy all graphs into your document and include descriptions and analysis in your document • In WINPLOT, set the domain to [–2,2] and when analyzing a graph, state the location of the 5 keys points • Your analysis will describe the amplitude, period, location of the equilibrium axis, and where one cycle starts
(D) Transforming y = sin(x) • Graph y = sin(x) as our reference curve • (i) Graph y = sin(x) + 2 and y = sin(x) – 1 and analyze what features change and what don’t? • (ii) Graph y = 3sin(x) and y = ¼sin(x) and analyze what features change and what don’t? • (iii) Graph y = sin(2x) and y = sin(½x) and analyze what features change and what don’t? • (iv) Graph y = sin(x+/4) and y = sin(x-/3) and analyze what changes and what doesn’t? • We could repeat the same analysis with either y = cos(x) or y = tan(x)
(E) Combining Transformations • We continue our investigation by graphing some other functions in which we have combined our transformations • (i) Graph and analyze y = 2sin(x - /4) + 1 identify transformations and state how the key features have changed • (ii) Graph and analyze y = -½ cos[2(x + /60] identify transformations and state how the key features have changed • (iii) Graph and analyze y = tan( ½ x + /4) – 3 identify transformations and state how the key features have changed
(F) Transformations Generalizations • If we are given the the general formula f(x) = a sin [k(x + c)] + d, then we have the following features in our transformed sinusoidal curve: • (i) amplitude = a • (ii) period = 2/k • (iii) equilibrium axis y = d • (iv) phase shift c units to the left or right, depending on whether c>0 or c<0
(G) Internet Links • http://www.analyzemath.com/trigonometry/sine.htm - an interactive applet from AnalyzeMath • http://ferl.becta.org.uk/content_files/resources/colleges/blackpoolsixthform/cameron/Transform%20of%20Trig1.xls - another interactive applet
(H) Examples Ex 1 – Given f(x) = 4sin(2x-/2) + 1, determine the period, amplitude, equilibrium axis and phase shift Ex 2 – If a cosine curve has a period of rad, an amplitude of 4 units, and the equilibrium axis is at y = -3, write the equation of the curve.
(I) Homework • From the Nelson textbook, p456-457, Q1-12