ARCC (Accountability Reporting for Community Colleges)
180 likes | 386 Vues
ARCC (Accountability Reporting for Community Colleges). Board of Trustees Study Session Presentation October 10, 2007 Cathy Hasson (Skyline) Jing Luan (District) Eric Raznick (District) Bart Scott (Cañada) John Sewart (CSM). From Where did ARCC Originate?.

ARCC (Accountability Reporting for Community Colleges)
E N D
Presentation Transcript
ARCC(Accountability Reporting for Community Colleges) Board of Trustees Study Session Presentation October 10, 2007 Cathy Hasson (Skyline) Jing Luan (District) Eric Raznick (District) Bart Scott (Cañada) John Sewart (CSM)
From Where did ARCC Originate? • Evolved from “Partnership for Excellence” • Created by legislative mandate (AB1417) to quantify performance within the community college • Indicators developed by the State Chancellor’s Office and the statewide Research and Planning Group (The RP Group)
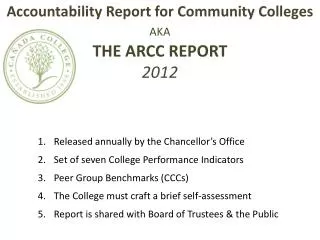
What does ARCC do? • Requires an annual report to the Legislature • Informs the local boards of trustees of the college performance • Sets a standard for accountability and results for California’s community colleges • Reports outcomes at the college level, as well as the system level
What ARCC doesn’t do? • Rank one college against the other • Tie to any funding mechanism • Track intra-district enrollment
ARCC Indicators • Student Progress & Achievement • Percent of Students Earning 30 Units • Persistence Rates • Course Success Rates • Vocational • Basic Skills • Basic Skills Improvement Rates
Peer Groups & Data Clusters • Peer groups were determined by cluster analysis--Partitioning the dataset into groupings that minimize differences. • Strength-Powerful analytical tool • Weakness-Cannot use qualitative data • Note: Different datasets were used for each indicator, so each indicator has a different peer group
Data Elements in Peer Groups • Student Info: Age, Education Level, Enrollment, Financial Aid, Gender, & Load • Academic Preparation (Stanford 9 scores) • Distance from nearest CSU/UC • SAT scores at nearest CSU/UC • Service Area Income
Update for ARCC 2008 • Ancillary 2008 analyses are under way • Create performance indicators for noncredit courses • State will conduct a new peer group analysis
Where Does the ARCC Data Come From? • Based on existing data from MIS (Management Information System) • Data clean-up project to improve results - CRCC (Curriculum Reporting for the Community Colleges) • Improved data from CRCC will contribute to a usable ESL improvement rate for the ARCC
ARCC Contacts • Cathy Hasson (Skyline) • Jing Luan (District) • Eric Raznick (District) • Bart Scott (Cañada) • John Sewart (CSM)