Download
1 / 22
230 likes | 376 Vues
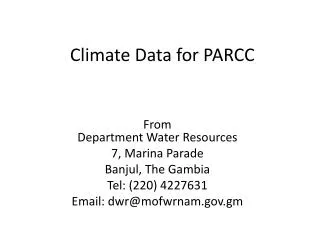
B M K G. CLIMATE DATA VALIDATION AT BANTEN and DKI JAKARTA PROVINCE (Rainfall and Temperature Data). Darman Mardanis, SE Stasiun Klimatologi Pondok Betung BMKG. Background. How to make climate data qualified; to make better climate prediction

E N D
B M K G CLIMATE DATA VALIDATIONAT BANTEN and DKI JAKARTA PROVINCE(Rainfall and Temperature Data) Darman Mardanis, SE Stasiun Klimatologi Pondok Betung BMKG
Background • How to make climate data qualified; to make better climate prediction • So many UPT BMKG have a lot of climate data but fortunetly without validation • Climatological station main job : Observation, Collection,Analyse data and finally come up with information.
Objectives • Doing validation for climate data qualification • To provide climate data with good qualification (especially for Banten dan DKI Jakarta Province) • Create a simple database system for Banten and Jakarta Province • To support climate prediction
Flowchart Entry Data Data Processing Output Checking no yes Validation Create Valid Data File
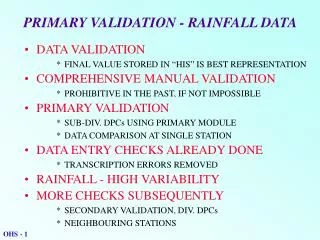
DATA VALIDATION As general, Data validation is the means by which data are checked to ensure that the final data stored in database system is the best possible representation of the true value of the variable at the measurement site at a given time or in a given interval of time or a certain time period. The important thing is, Validation process is just to find the correct data but not to find the mistakes. Validation data process is same as quality data control
Climate Validation Methode • Primary Validation Method: • Validation data process is on the place that doing the observation. • For single data series; comparing observation data value with pre-set physical limits. • ex. Range for temperature data are 20oC-37oC • Doing the sequence test with graph, to detect the trend or deviation from normal value • Compare value from two unit obeservation instrument. • ex. Dry termometer and wet termometer
Simple Primary Validation Is it true? • Expected: • Human error • Instrument error, etc
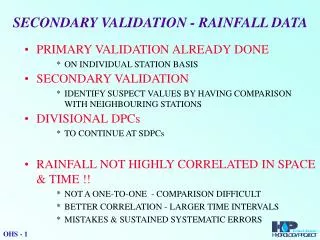
Validation Methode • Secondary Validation Method: • Validation data process > comparison the climate data from two place. • Note. Searching nearby place • For multiple station: • 1. Balance series • 2. Analysis Regressi • 3. Double Mass Curve, etc • For single station: • 1. Trend Analysis • 2. Residual Mass Curve • 3. Run Test, etc
PRIMARY VALIDATION FOR CLIMATE DATA AT BANTEN AND DKI JAKARTA PROVINCE
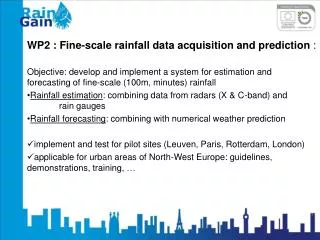
Primary Validation Rainfall • Rainfall measurement: • Obs Type (manually) • Hillman Type (automatically) • Tipping Bucket/ARG/ AWS (digitally) • Comparison value of daily data rainfall from Obs, Hellman and Tipping Bucket type: • Rainfall data from 3 measurements must be different • Obs type is still needed although Automatically and digitally type are available • Value from Obs type assesed correctly. Assumption, error value from two other devices is so high • If there’s an error from Hillman and digital, it’ll be came from instrumentation error or wrong observation
Primary Validation Temperature • Primary validation temperature principles: • Maximum temperature must be higher than minimum temperature • Maximum temperature must be higher than temperature 13.00 local time • Minimum temperature must be lower than temperature 07.00 local time
Step-step: • Open Microsoft Office Excel • Open compilation climate data file • Click menu data-filter-auto filter • Flag data suspect (based on range data table)
Maximum temperature and Temperature 13.00 on 2007 at PondokBetung
Analyse From graph, we can compare maximum temperature value (blue line) with temperature 13.00 LT value (red line). Base on our principle before that Max temperature must be higher than temperature 13.00 LT. On the graph, max temp on Feb 2007 lowest than temperature 13.00 LT (suspect value) Cross check with hardcopy
Run Test Rainfall Data Runs Test is a nonparametric test because no assumption is made about population distribution parameters. This test can be determine if the order of responses above or below a specified value is random. A run is a set of consecutive observations that are all either less than or greater than a specified value.
Rainfall on 2000-2009 at PondokBetung Doing secondary validation with Run Test-Minitab
Runs Test: Rainfall Runs test for Rainfall Runs above and below K = 332 The observed number of runs = 8 The expected number of runs = 5.8 4 observations above K, 6 below * N is small, so the following approximation may be invalid. P-value = 0.1223 (P-value)< 0.05 tidak homogen (p-value)> 0.05 homogen HOMOGEN
Conclusion: • The right climate information support by good quality of data. • We must have a simple validation method
Thank You STASIUN KLIMATOLOGI PONDOK BETUNG JL. RAYA KODAM BINTARO NO.82 JAKARTA SELATAN – INDONESIA TEL/ FAX. +62217353018 / 7355262 http://www.staklimpondokbetung.net staklim.pondok.betung@gmail.com