Engaging Hispanics
470 likes | 495 Vues
Engaging Hispanics. No Small Minority!. Elizabeth A. Erkel, PhD. February 2019. Table of Contents. Preface Hispanic voters Characteristics of the Hispanic population Tips for engaging Hispanic voters GOTV resources References. 3 7 30 36 44 48. Preface.

Engaging Hispanics
E N D
Presentation Transcript
Engaging Hispanics No Small Minority! Elizabeth A. Erkel, PhD February 2019
Table of Contents Preface • Hispanic voters • Characteristics of the Hispanic population • Tips for engaging Hispanic voters • GOTV resources • References 3 7 30 36 44 48
Preface Welcome to Engaging Hispanics! • This tutorial will help you plan and carry out simple and effective nonpartisan voter engagement activities through understanding the Hispanic population and their characteristics and using tips for engaging Hispanic voters. • GOTV action involves vision, strategy, and tactics as depicted on the next page.
GOTV Action Program Encouraging informed and active participation in government by facilitating voter engagement. Increased voter turnout in Texas Interactive & meaningful communication GOTV tactics that work* 5% from 2012 to 2020 *Evidence-based GOTV Action Program adopted at LWVTX 2016 State Convention
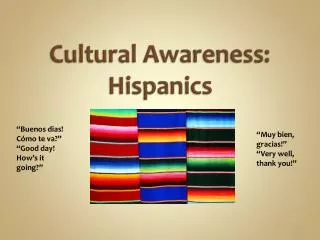
Hispanic?Latino? Or Latinx? Latin American Blas, 2015; Garcia-Navarro, 2015; Passel & Taylor, 2009, May 28
Hispanic?Latino? Texans prefer Hispanic over Latino “Do you happen to prefer one of these terms more than the other?” Pew Research Center Survey of Hispanic Adults, May 24-July 28, 2013 5,103 Responses Lopez, 2013
1. Hispanic voters • Who makes up the electorate? • Who votes? • Are Hispanics politically disengaged? • Why a lower turnout among Hispanics?
Who makes up the electorate? 2016 Eligible Voters The proportion of eligible voters who are Hispanic is higher in Texas than the nation as a whole. U.S. Census Bureau, 2016, Oct. 28
The rising Hispanic electorate 26.7 M 140% in 20 years 11.2 M 4.8 M 25% in 20 years 2.7 M Texas accounted for 20% of the growth in the Hispanic population in the U.S. from 2015 to 2016. Krogstad, 2017,Aug. 3; U.S. Census Bureau, n.d.-b
Who votes? White Not Hispanic Black Not Hispanic Other Not Hispanic Low voter turnout among Hispanics eligible to vote Hispanic All 61% *% of citizen voting age population U.S. Census Bureau, 2017, May-a
% of Reported Voters, by Race & HispanicOrigin, U.S., 1980, 1996, & 2016 88% 3% 9% 11% 5% 83% 73% 12% 9% 6% Hispanic share of voters tripled in 36 years. U.S. Census Bureau, 2017, May 10
Hispanics in 2020 in the United States • 42.7 million of voting age • 28.9 million eligible to vote • 12% of all eligible voters • 13.7 million likely voters • 9.5% of all likely voters U.S. Census Bureau, 2014, Dec. & 2017, Feb. 1
Texas Hispanics −No small minority in 2016… 11 million Hispanics lived in Texas State population is 39% Hispanic Equal to the total population of 11 other states AK, MT, WY, ND, SD, NE, ME, NH, VT, DE, & RI Dallas has as many Hispanics as Wyoming has people U.S. Census Bureau, n.d.-a
Hispanics are the future … 0.5 Migration Scenario Race/Ethnicity Texas Demographic Center, n.d.
Hispanics in 2020 in Texas • 8.2 million of voting age • 5.5 million eligible to vote • 30% of all eligible voters • 2.2 million likely voters • 22% of all likely voters Lopez & Stepler, 2016, Jan. 19; Texas Demographic Center, n.d. U.S. Census Bureau, 2016, Sep. 15 & 2017, May-a
Who makes up the electorate? Edward James Olmos, trusted Hispanic leader The growing Hispanic electorate could become a powerful share of the voting population in the near future. This year your vote is a serious matter Garza, 2016; Grossman, 2015
Are Hispanicsdisengaged? • Measures of civic engagement • Social connectedness • Civic involvement • Political participation University of Texas, 2018
Social connectedness Individuals with strong relationships with family, friends, and neighbors are more likely to participate in the civic life of their community. Colleagues Friends Family Neighbors Organizations University of Texas, 2018
Social connectedness Hispanic adults trust & interact less with their neighbors than non-Hispanic adults. 2013 CPS Civic Engagement Supplement (N = 3539 Adults 18+ Yrs ) Rouse et al., 2015
Hispanics have close family ties and loyalty with extended family bonds. Social connectedness • Despite being a diverse population, Hispanics generally, place a high value on • Close-knit families • Group welfare • Social harmony • Personal respect 10-minute video Latino Culture & Values http://tinyurl.com/y896nhc4 Noguera, 2016, Feb. 25; Vega-Costas, 2012
Civic involvement Residents improve their communities by joining groups, volunteering and donating, attending community meetings, and working with their neighbors to address problems. University of Texas, 2018
% Respondents (Aged 50+ Years) Involved in the Community, by Civic Activity & Race/Ethnicity, U.S., August 2015 Civic involvement was less likely among midlife & older Hispanic adults than their black or white counterparts. # Respondents White NH = 1168 (*914) Black NH = 714 (*527) Hispanic = 725 (*406) NH = Not Hispanic Williams, 2017, Jan., p. 34
Political participation Citizens influence government policies and decisions that affect their lives by participating in politics−voting and contacting their elected officials. University of Texas, 2018
Political participation Hispanic citizens of voting age are less likely than others in Texas and nationwide to discuss politics, vote, contact public officials, boycott/buycott products and services or participate in other political activities. Rouse, 2015; University of Texas, 2018
% Respondents (Aged 50+ Years) Participated in Politics, by Civic Activity & Race/Ethnicity, U.S., August 2015 Political participation was less likely among Hispanic adults than black or white adults. # Respondents White NH = 1168 Black NH = 714 Hispanic = 725 NH = Not Hispanic Williams, 2017, Jan., p. 34
Estimated No. (Million) Hispanic Citizens of VotingAge, Registered Voters, and Voters in Presidential Elections, 2016 United States Texas 14.0 million Unengaged* voting age voting age to vote to vote *Unregistered & nonvoting-registered Hispanic citizens of voting age. U.S. Census Bureau, n.d.-b
Among Hispanics, the top reasons for not voting in 2016 were: Too Busy 16% 25% 17% Didn’tlike U.S. Census Bureau, 2017, May-b
Other influencing factors… Native or naturalized citizen Hispanic origin Dominant language Level of civic engagement Perceived Influence on community + + + Obstacles that hinder Hispanic civic participation: Over half Hispanics age 50+ felt they had little or no influence on community problems. Cuban Americans more likely to vote than Mexican Americans. Native-born Hispanics less likely to vote. For 1st generation: Inability to speak English well well hinders voting & group participation. Overall civic engagement lags behind non-Hispanics + + + Rouse et al., 2015; Williams, 2017, Jan., p. 16
Other influencing factors… The fight for voting rights in Texas Poll Tax 1902-1966 Southwest Voter Registration Education Project founded 1974 1971 ID Required 2011 Photo ID Required All-White Primaries 1923-1944 Los Cinco Elected Crystal City 1963 1975 VRA Extension Acosta, 2010; Calmexcenter, 2016, Sep. 14; Cruz, 2016, Oct. 10; Gabriel-Robbins, 2015, Dec. 24
2. Characteristics of Hispanics • Native, naturalized, undocumented • Varying heritage • Culturally diverse • Shared values • Common traits
Hispanic Population, by Citizenship, United States & Texas, 2016 United States Texas Most Hispanics are born in the U.S. & bilingual 18% Hispanic (57.4 M) 39% Hispanic (10.9 M) Foreign-born 29% Foreign-born 34% U.S. Census Bureau, 2016, Sep. 14 (Tables B050031 & B16006)
Hispanic Population, by Specific Origin, United States & Texas, 2016 Most Hispanics are of Mexican heritage United States Texas 18% Hispanic (57.4 M) 39% Hispanic (10.9 M) Other Other U.S. Census Bureau, 2016, Sep. 14 (Table B03001)
Culturally diverse Hispanic Hispanic describes countries of origin that were once under Spanish rule. • Diverse social, economic, & geographic backgrounds with different traditions, customs, cuisine, dialects • Catholic and Protestant • Different levels of acculturation, but slower assimilation • Thus Hispanics don’t • View the world the same • Eat the same foods • Dress the same • 1st generation may not be bilingual Vega-Costas, 2012
Shared values Hispanic Rich in diversity & Rooted in common values • Strong family identity, attachment, loyalty, reciprocity, and solidarity • Emphasis on group welfare with shared responsibility and accountability • Social harmony−smooth, pleasant social relationships • Respect for elders and authority figures Camacho, 2006, Apr. 5; Centers for Disease Control, n.d.; Vega-Costas, 2012
Common traits Hispanic Rich in diversity & Sharing attitudes & ways • Many Hispanics speak Spanish at home. • Hispanic families, on average, are larger with more children than non-Hispanic families. • Extended family members and close friends and associates are considered part of the family. • While men tend to be the economic providers, women tend to make decisions on how income is spent. • Religion is very important in a majority of Hispanic’s lives. • Hispanics enjoy close personal space in social interactions. Camacho, 2006; Pew Research Center, 2014; Krogstad & Lopez, 2017, Oct. 31; U.S. Census Bureau, 2016, Nov-a & b, 2017, Oct. 19; Vega-Costas, 2012
3. Tips for Engaging Hispanic Voters Hispanic voters are similar to other voters in that personal contact, outreach, and mobilization campaigns work • Different tactics have different effects Barreto, 2017, Aug.
Person-to person contactmost effective with Hispanics Informal conversations Canvassing Local, bilinguual, Hispanic canvassers are more effective than outsiders. Most effective within the 2 weeks before Election Day • Talk about voting informally with friends, family, co-workers, and neighbors • Use a flexible, personalized message Barreto, 2017, Aug.; Green & Gerber, 2015, p. 33; Michelson et al., 2009, p. 6
Person-to person contactmost effective with Hispanics Phone banks Live! Bilingual callers Relaxed, authentic style Short-interactive script Two-round phone banks improve impact: Make follow-up calls to those who said they would vote made during the week before Election Day. ~ one voter produced for every 35 contacts Arceneaux, 2007; Bedolla & Michelson, 2012, pp. 78 & 83; Green & Gerber, 2015, pp. 80-83; Nickerson, 2007
Messages that resonatewith unengaged Hispanic votersUnregistered or nonvoters • Community • Ethnic pride • Solidarity Barreto, 2017; NALEO, 2012
Messages that resonate “From Mexico to the Middle East, across the world thousands of people risk their lives to vote and be heard. We can’t take it for granted. It’s time we vote.” Civic participation message most effective with: • Spanish-speaking citizens • Citizens 25-39 years old NALEO, 2012
Messages that resonate “We CAN make a difference. Make your voice heard in our democracy. We need to vote, one vote can make a difference.” Make a difference message most effective with: • Foreign-born citizens • Those 60 years old and older • Moderate and higher income • Those with a high school education or less NALEO, 2012
Messages that resonate “If you don’t vote and take part in democracy nothing will ever change. The only way to change our communities for the better and move our country forward is to vote.” Impact message most effective with: • English-speaking citizens • U.S. born citizens • Those 40-59 years old • Low-income citizens • Those with some college or more NALEO, 2012
Messages that resonate “Many states are considering passing laws that discriminate against Hispanics, like S.B. 1070 in Arizona. Only by voting can we change these laws.” Discrimination message most effective with: • Those 28-24 years old NALEO, 2012
4. GOTV Resources Voter mobilization tutorials Evidence-Based Practices for Voter Mobilization • The principles behind effective GOTV campaigns https://my.LWV.org/Texas/Best-Practices-GOTV
Voter mobilization tutorials Tactics That Work for Voter Mobilization • Choosing and using effective GOTV tactics Interactive, meaningful communication Videos Pledge cards Text messages Elevator speech Live phone banks Social pressure on social networking sites Conversations Canvassing https://my.LWV.org/Texas/Best-Practices-GOTV
Voter mobilization tutorials What to Say: Effective GOTV Conversations • How to talk about voting • Snippets of conversation you can use https://my.LWV.org/Texas/Best-Practices-GOTV
Voter education resources https://my.LWV.org/Texas/Get-Out-Vote-0 • Presentations • Grab n’ Go packages combining a PowerPoint presentation with its script, a handout, and teaser video • Printed Materials • Bookmarks, Cards − Brochures • Fact Sheets − Graphics • Social Media & Web Sties • Links − Examples of social media content • Toolboxes • Instructions for implementing successful GOTV ideas a local League has used.