Download
1 / 60
620 likes | 656 Vues
Explore the diverse climate archives and key time periods, from geological sediments to ice cores, unraveling Earth's atmospheric evolution. Discover the impact of climate events through fossil records, tree rings, and historical documents. Dive into the atmospheric composition and Earth's primordial atmosphere. Uncover the monumental shift from primordial gases to modern atmospheric balance over billions of years, influencing fossil records and sea-level changes.

E N D
Paleoclimatology Anna Klene Department of Geography University of Montana
3 Objectives • Discuss climate archives • Piecing the puzzle together • Discuss key climate events using these different archives • Current understanding of atm evolution • Review key time periods of interest to current warming
Time scales for Proxy Data Ruddiman, 2008
Archives of Climate Change: • Geological • Biological: Fossils & Pollen • Cryological: Ice Cores • Historical • Biological: Tree-Rings • InstrumentalRecords • Proxy: Using one thing in place of another... • Always better if 2 different, independent proxies agree
Archives of Climate Change: Geological Sediment structures & material (loess) Glacial moraines Lake sediments Coastal & Deep Ocean sediments
Archives: Biological Fossils or dead material Trees Critters (macro: mammals, beetles, etc. & micro: corals, plankton, forminifera, etc.)
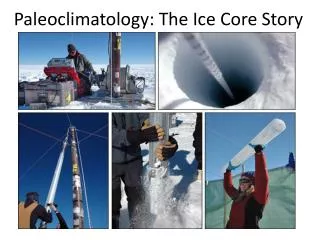
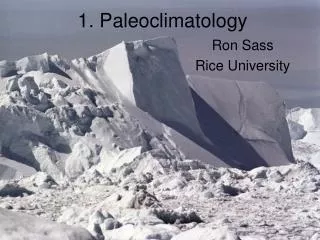
Archives of Climate Change: Cryological Glaciers & Ice Caps
Ice & Sediment Cores Cores • Oxygen-isotope analysis: • 18O • Measure ratio of 16O to 18O • Water from ocean enriched in 18 as 16 evaporates better… • When glaciers advance, more 16 frozen, so even more 18 in water…
Ice Cores & Sediment Cores • deuterium/hydrogen ratio: • D‰ • Measure ratio of 2H to 1H… • Deuterium is heavier than normal Hydrogen, so it takes more energy to evaporate any water molecule made with “heavy hydrogen”. • The result is that the colder it gets, the less Deuterium ends up in precipitation. • The smaller the D/H ratio, the colder the climate.
Ice Cores • Ice cores: • volcanic ash • particulates (dust), • pollen, • chemical composition of the air trapped inside, • etc..
Archives • Volcanic Ash • Source by chemical signature • Provides a calibration layer across variety of deposits From Skinner
Tree-rings: • Annual layers of growth • Depends on temp, precip, evapotrans. • Varies from species to species http://web.utk.edu/~grissino/gallery.htm
Archives of Climate Change: Historical Records Letters, Diaries, Other Records • Hunters in the Snow, 1565Pieter Bruegel the Elder (Netherlandish, ca. 1525/30—1569)Oil on panel; 46 1/8 x 63 7/8 in. (117 x 162 cm)Image courtesy of the Kunsthistoriches Museum, Vienna
Archives of Climate Change: Instrumental Records Only within last ~200 years
Earth’s Evolution • ~4+ BYA: All blown away • ~4: Magnetic field forms & atm held in place – no O2 • ~3.8: Out-gassing continues but liquid earth possible as planet cools below 100°C • ~3.5 BYA: First life forms release O2 • ~500 MYA: O2 levels high enough for ozone layer & plants & animals can now colonize land • All from geological evidence!!
Earth’s Primordial Atmosphere 4+ billion years ago (Y.A.) Consisted of gases most abundant in solar system, hydrogen and helium (lightest elements) Mainly blown away
Earth’s Primordial Atmosphere 4+ Billion Y.A. Begins build up once magnetic field developed Consists of CO2, NO*, H2O
Stromatolites Photosynthesis • CO2 + H2O + light CH2O + O2 • Cyanobacteria (Eubacteria) aka blue-green algae, appear ~ 3.5 bya • Release O2 as byproduct • Accumulation of O2 in the atmosphere didn’t start until oceanic Fe2+ was oxidized (~2 bya).
Banded Iron Formations • Water with O2 (from blue-green algae) & Fe from surface weathering. • Get deposits (iron-rich layer) This cleans algae's environment. • Too much algae, produce too much O2, not enough Fe to remove it… • O2 toxic to algae, population collapse… (get white layer) The red bands are hematite, and are interbedded with chert.
Core from the Permian red beds that underlie the High Plains aquifer in southwestern Kansas and the Oklahoma panhandle Red Beds • ~1.8 BYA once all iron in ocean reacted with O2, it could build up in the atmosphere, leading to the oxidation of iron on exposed surface. • This Fe2O3 is seen in geological formations called Continental Red Beds • Only after the surface iron reacted could O2 then build up in the atmosphere Carachipampa Volcano and Red Beds, N.W. Argentina
Earth’s Modern Atmosphere 500 MYA enough O2 that O3 layer began That protects green plants to colonize land
Atmospheric Composition • The release of O2 by photosynthesis is probably the most significant effect of life on the geochemistry of the Earth.....until man!
Earth’s Modern Atmosphere Just 2% of all O2 released over 3.8 BY is in atm. Now, a balance between O2 producers and users??
Fossils • Cretaceous (100 million ya): +15°C warmer than now • Sea level 200 m higher http://www.scotese.com/Default.htm
Fossils • Early Eocene (55 million ya): +7°C warmer than now • May have been a methane release http://www.scotese.com/Default.htm
Fossils • Messinian Crisis (5-6 Mya): may be coldest, sea level well over 100 m lower than today
Sea-level changes • Can think of sea level as reflecting relative warmth of whole planet • Basin factors • Shape • Slower sea-floor spreading • Continental collisions • Volcanic plateaus
Sea-level changes • Climate factors • Ice sheets • Thermal expansion (0.015% for each 1°C)
Past 2.75 Million Years • From deep-sea drilling: • At least 50 glacial-interglacial cycles superimposed on the long term cooling trend… • 90% of last 0.9 MY there were ice sheets on Earth
Astronomy • 1911: Milutin Milankovitch proposes: • All 3 cycles (23, 41, & 100 KYA) together control ice ages • Summer insolation is driver
Milankovitch Cycles • 1976: Jim Hays, John Imbrie, and Nick Shackleton publish first confirmation of Milankovitch theory • Used corals to give dates with uranium decay isotope analysis
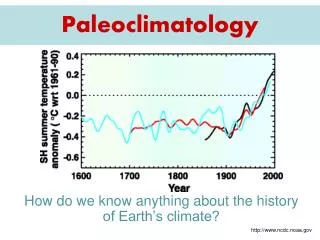
CO2 over past 800,000 years 383 ppm in 2007 The top plot shows levels of carbon dioxide in the atmosphere. The data shown in green is actual concentrations measured at Mauna Loa in Hawaii. The red line on the CO2 plot is from Law Dome and the remaining data from two other ice core sites in Antarctica; Vostok and Dome C. Plots courtesy of EPICA. Data from Luethi et al 2008 (CO2) and Jouzel et al 2007 (temperatures). Thanks to Eric Wolff of BAS for supplying the information. .
Milankovitch Cycles • Get reconstructed temps. • Switch from 41 & 23 dominant to 100 dominant about 800 KYA
Last Glacial Maximum • World sea level fell at least 100 m, thereby causing large expanses of the shallow continental shelves to emerge as dry land • Disruption of major stream systems. • The Missouri and Ohio rivers to move into new courses beyond the ice margin.
Deglaciation • Meltwater pulses… • Several different ones interrupt steady retreat of ice sheets
Younger Dryas • ~3,000 year return to glacial conditions in midst of deglaciation • “Younger Dryas” • 15-12,000 years ago • Pollen of dryas returns to Europe • Scary part: transitions very sudden, within a decade!!!
Younger Dryas • Think caused by movement in polar front. • Front: area between two air masses • Was S of England during glacial, shifts N during interglacial. • During YD, it reverted…
Thermohaline Circulation • Wally’s hypothesis: • Cut off NADW = return to glacial conditions • Must suddenly change input into North Atlantic… • What could happen???
Quelccaya Ice Cap, Peru 1977 2002 Photos: Lonnie G. Thompson: Ohio State University
Quelccaya Ice Cap, 2002 200 – 400 m above its modern range Cushion Plant Photos: Lonnie G. Thompson Ohio State University