Download
1 / 23
240 likes | 415 Vues
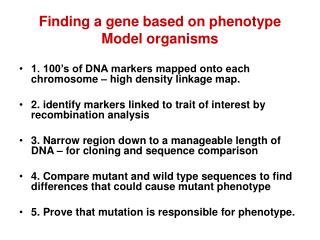
Finding a gene based on phenotype Model organisms. 1. 100’s of DNA markers mapped onto each chromosome – high density linkage map. 2. identify markers linked to trait of interest by recombination analysis 3. Narrow region down to a manageable length of DNA – for cloning and sequence comparison

E N D
Finding a gene based on phenotypeModel organisms • 1. 100’s of DNA markers mapped onto each chromosome – high density linkage map. • 2. identify markers linked to trait of interest by recombination analysis • 3. Narrow region down to a manageable length of DNA – for cloning and sequence comparison • 4. Compare mutant and wild type sequences to find differences that could cause mutant phenotype • 5. Prove that mutation is responsible for phenotype.
Parents: Col-0 a/a X La-er GL1/GL1 genotypes F1 is self fertilized – all chromosomes recombine in meiosis F2 plants – recombined chromosomes segregate How to do this with an organism that cannot fertilize itself, like a mouse?
Mouse mapping Panels Backcross panel Cross parents from inbred lines, B and S BXS heterozygote cross to either B or S Progeny are recombinant BS/parental S • like a test cross. Each mouse represents one BS recombinant chromosome.
Parents: Col-0 a/a X La-er GL1/GL1 genotypes F1 is self fertilized – all chromosomes recombine in meiosis F2 plants – recombined chromosomes segregate
Mapping an Arabidopsis gene Analyze segregation data in an F2 population. Both chromosomes have had the opportunity to become recombined in the F1 parent To avoid confusion, we focus on one locus of interest. We chose individuals that are homozygous for one allele at that locus, eg. a clear phenotype. Closely linked markers will also be homozygous in the chosen individuals. As markers are farther away on the chromosome, more of the individuals will have two different parental alleles for the marker genes.
Interval mapping: Identify markers linked to the gene of interest that define an interval on a chromosome.
Markers that define major regions of the Arabidopsis chromosomes
F2s are selected as homozygous recessive gl1/gl1 by phenotype eg. Scored for 5 markers 1, 2 are not linked to GL1 13: 25: 12 C/C:C/L:L/L Map distance is calculated as #recombinant alleles/total X 100 cM 50% of alleles are C and 50% are L. Therefore the map distance from GL1 to 1 is 50 cm
Marker 1 from a previous year. The first lane is the glabrous mutant (Columbia), the second lane is a mixture of 1 and 3 The third lane is Landsberg The rest are DNA from F2 plants
3, 4, and 5 are linked to GL1 Marker 3 is closest to GL1 Map distance is calculated as #recombinant alleles/total X 100 cM 3 is 4/100 X100 cM from GL1 = 4 cm 4 is 30 cM 5 is 20 cM
Markers 3, 4 and 5 are linked to Gl1 Need to find another marker on the opposite side to define the interval that contains GL1. gl1 gl1 3 3
Markers 3, and 5 flank GL1 Plant 3 is C/L at 3 L/L at 4 and C/C at 5 There has been no crossover between GL1 and 5 And 5 is further away from GL1 than 3. This means 3 and 5 define the interval that contains GL1. Plant 3 5 gl1 3 Col-0 4 La-er
Plants 3, 4, 5, 8 and 10 are useful to find closer markers There is a recombination event either between 3 and gl1 or between 5 and gl1
5 5 5 5 5 5 gl1 gl1 gl1 gl1 gl1 gl1 3 3 3 3 3 3 4 4 4 4 4 4 Plants 3, 4 and 5 have recombination points within the interval that defines the location of GL1 They will be useful for further mapping Plant 4 Plant 5 Plant 3 is C/L at 3 L/L at 4 and C/C at 5 Plant 4 is C/C at 3 C/C at 4 and C/Lat 5 Plant 5 is C/L at 3 C/L at 4 and C/C at 5 Plant 3 Col-0 La-er
Using closely linked Markers to identify a small interval containing GL Once we find flanking markers that are both on the same BAC, we are done with mapping F2 plants.
Making a library of clones that represent the entire genome - Putting them in order to represent the genome sequence
Identify a BAC clone that must include your gene • Find two flanking markers contained in a single BAC (large insert plasmid) clone. • Look at GenBank entry for that BAC clone to identify candidate genes between your flanking markers • Open reading frames, • mRNA (cDNA) clone already identified, • Predicted gene regions
Once we have defined 2 markers flanking our interval that are physically close enough, we start sequence analysis for point mutations. MDF20 MYN21 BAC T22A15 100 kb insert BAC sequence gives us a list of genes. Candidate genes can be PCR amplified from the mutant and the sequence can be compared to wild type. When a mutation is identified, we call that a candidate gene. Sequence the same gene from more than one mutant to confirm or Transform mutant plant with wild type gene for complementation.
Final confirmation • Sequence mutant and wild type – multiple mutant alleles needed to be convincing • Complement mutation by making a transgenic with the wild type copy of the candidate gene.
Finding a gene based on phenotype • 1. 100’s of DNA markers mapped onto each chromosome – high density linkage map. • 2. identify markers linked to trait of interest by recombination analysis • 3. Narrow region down to a manageable length of DNA – for cloning and sequence comparison • 4. Compare mutant and wild type sequences to find differences that could cause mutant phenotype • 5. Prove that mutation is responsible for phenotype.