Download
1 / 24
250 likes | 430 Vues
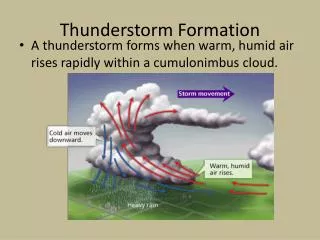
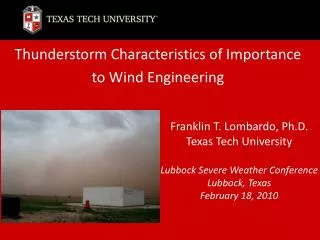
Thunderstorm Characteristics of Importance to Wind Engineering. Franklin T. Lombardo, Ph.D. Texas Tech University Lubbock Severe Weather Conference Lubbock, Texas February 18, 2010. PROBLEM STATEMENT. “Wind is Wind” Statistics for wind/pressure used in wind load standard (ASCE 7)

E N D
Thunderstorm Characteristics of Importance to Wind Engineering Franklin T. Lombardo, Ph.D. Texas Tech University Lubbock Severe Weather Conference Lubbock, Texas February 18, 2010
PROBLEM STATEMENT • “Wind is Wind” • Statistics for wind/pressure used in wind load standard (ASCE 7) • Wind Tunnel Data steady mean and variance stationary (log-law) • Validated with full-scale data that is stationary in boundary layer (SBL) over periods ranging from 10 minutes to 1 hour (spectral gap) • Extreme events (e.g. thunderstorms, hurricanes) --> non-stationary control design in most of the US • Assume that physical and statistical characteristics are the same An example of a stationary wind record (left) and a thunderstorm record (right)
INTRODUCTION • Non-Stationary Wind/Pressure Data • Wind/Pressure Statistics (e.g. turbulence intensity, pressure coefficient) • Use mean wind speeds within the spectral gap • Thunderstorm usually occur over durations shorter than the spectral gap (~ 1-10 min) and display non-stationary characteristics, especially short duration “ramp-up” events • Difficult to make comparisons between stationary and non-stationary data; statistics not representative • Attempt to collect additional thunderstorm data and facilitate comparisons of the two events
INTRODUCTION • Facilities/Instrumentation/Data Collection • Wind Engineering Research Field Laboratory (WERFL) • 200 Meter Tower • Meteorological instrumentation on 10 different levels 3’ to 656’ • 204 differential pressure taps (building) (104 walls, 90 roof) • 30’ sonic geometric center • 160’ tower 5 levels • ~ 150 feet away • Now at Reese building remains • 13’ Tower, 30’ Sonic
THUNDERSTORM EVENTS • “Ramp-Up” Types/Characteristics • Exhibit rapid increase/decrease in wind speed over a short period • Time histories show some similarities but no universal form (wide variability) • Some occur over “longer” scales (~ 2 min), others “shorter” (~ 10 sec) 9 events 58
THUNDERSTORM TIME SCALES • Andrews AFB Microburst (1983) 90-100 seconds • Standard for wind engineering use ~ 150 mph gust; poor data quality • Lubbock RFD (2002) 100 seconds (Holmes, 2008), 2 – 3 minutes (Kwon and Kareem, 2009) • ~ 90 mph gust design wind speed for most of the country; high resolution data • Want to determine information of importance to wind engineering • Previous studies used “time-varying mean” for non-stationary events to quantify information • Created algorithm to measure durations of “stationary turbulence” • Stationary turbulence that contained peak wind speed was used
RESIDUAL TURBULENCE Using 17 second averaging time Mean Residual Turbulence Duration ~ 150 s Appropriate time periods for analysis in thunderstorm prone areas should be 60 – 200 seconds These representations (using 15 – 60 s averaging time) can be used for further wind engineering statistics (TI, GF, PSD) Likely areas a higher turbulence on small scales shown in previous figure (~10s) but would be near impossible to quantify
THUNDERSTORM VARIABILITY • So what does the reduced time scale and consideration for thunderstorms in structural design mean? • Increased Variability • Other studies (Ponte and Riera, 2007) have shown highly varying time scales for thunderstorms • Other variability has been shown in vertical wind speed profiles, turbulence, etc… will show later • Assuming statistical and physical properties are the same for a moment 100 s 900 s Schroeder (1999)
WIND ENGINEERING PARAMETERS • Turbulence Intensity • Compared with SBL data (100 s segments) • All “ramp-up” events fall within range of SBL (33’) for 15-60 s averaging times • VORTEX2 case outside of range > 10 second averaging time (7 ‘) • Inherently additional turbulence, but likely not attributed to surface roughness
VORTEX2 CASE • May 15, 2009 North Central Oklahoma • Although wind speeds barely exceeded severe levels and are well below “design” values for a short period, it raises a number of interesting questions for wind engineering as it is a unique time history (TI values different) • Multiple rapid changes in wind speed and direction ~ 2 minute period • Periodic fluctuations on relatively smaller scales (0.03 – 0.05 Hz) • Also small spatial scale “probe” ~ 1 mile away did not record event
WIND ENGINEERING PARAMETERS • Gust Factor • VORTEX2 case, others, outside of range > 100 seconds, smaller time scales • Higher variability noted, few straddle bounds of SBL although most within • Suggests similar “gustiness” at short time scales • Ramp-Up GF different than one used in ASCE ~ 60-100 seconds • V2 GF for a 1500 second record was ~ 9
WIND ENGINEERING PARAMETERS • Power Spectral Density, Turbulence Scales • Look at “turbulence” in frequency domain; high frequency scales (along-wind component) • At frequencies > 0.05 Hz, thunderstorm energy is similar to SBL models • However V2 case shows strong energy at ~0.03-0.05 Hz (not shown) • Other cases show strong energy at ~ 0.01 Hz
VERTICAL WIND PROFILES T = 27s T = 20s T = 24s Max T = 0s • Important for Structural Loading • ASCE 7 assumes modified “log” profile for 3 second gust wind speed • Evolutionary factors not considered in wind engineering • Design exceedance at only one or multiple levels • Taken from 200 meter tower Reese Field Site • Transition from SBL to impinging jet 30s • Momentum works downward with time • Below maximum wind speed resembles SBL profiles (low as 13’)
VERTICAL WIND PROFILES T= 130 s T= 0 s T= 50 s • Other Examples • Some cases show close to uniform profile; noted in other extreme wind studies • Compared with SBL 3-second maximum gust profiles • 0.30 z/zmax compared to 0.88 z/zmax for SBL (highly variable) • Environmental conditions, storm type (i.e. isolated microburst, bow echo, supercell) need to be further studied • Highest wind speed at surface similar whereas highest overall wind speed from HP supercell/bow echo June 4, 2009 June 19, 2008 June 19, 2003 “Impinging Jet” “Log” “Uniform”
VERTICAL ANGLE OF ATTACK (33’) w V • Noted in studies (Wu, 2001; Richards and Hoxey, 2004) to induce high negative pressures on roof with positive (upward) angles…NOT vertical wind speed • No significant differences detected versus SBL • Even in “ramp-up” events due to strong horizontal wind speeds • May be different as surface roughness becomes less dominant • Strong upward motion in tornadic vortices, for “high-rise” buildings > 60 feet
BUILDING EFFECTS • Pressure Coefficient vs. Angle of Attack (3 second) • Use sonic (30’) on top of WERFL assuming (2 events): • Uniform profile, no angle of attack changes from MRH to 30’ • Use (13’) ~150-200’ from WERFL (1 event) • Determine any flow field differences over that distance θ
BUILDING EFFECTS • ~ 95 % of ramp-up Cp’s (red) fell within range of WERFL SBL at similar AOA using peak 3-s gust • All fell within range in conical vortex regions • Flow features over building are similar
BUILDING EFFECTS • Interest of what happens in separation region during gusting conditions (Murgai et al., 2006;Hwang et al., 2001) • Temporal acceleration of wind has become area of interest (Doswell et al., 2009) • Criteria: 20 mph increase in 3s, flow normal to walls (gust, mean), AOA “constant” • Determination of: • Distance of Strongest Negative Pressure From Roof Edge • Aerodynamics Changes
BUILDING EFFECTS • Results • Mean cases 3.9 – 4.1 feet • Gust cases 2.0 – 5.3 feet high variability • Pressure distributions similar when using mean gust speed • Anemometer ~ 30 feet away still difficult to determine the effects at smaller time/length scales correlation of wind and pressure • May actually be gain additional information in wind tunnel where wind/pressure effects can be more easily measured/visualized
EXTREME WIND SPEED ANALYSIS • Current ASCE wind map uses “basic” wind speeds (3s gust) without regard for storm type and assumed uniform exposure • Computation of design pressure on a building for all US (most 90 mph) • Thunderstorm winds shown to have different probability distributions and dominate most US extreme wind climates including West Texas • ~ 200 ASOS stations in current analysis; high resolution data (WTM, StickNet), additional ASOS available to enhance current wind estimates (6 exceedances in 8 years); GIS programs to aid with address roughness issues • Due to small spatial scales (V2, others), wind speeds not in current analysis
EF-SCALE ISSUES/QUESTIONS • Main application is tornadoes but these research topics would apply to thunderstorm research as well • Temporal/Spatial character of high winds • Temporal Acceleration • Duration vs. Damage; Flow Modification • Coherence/Correlation • Wind Speed vs. Damage Relation • Rapid Wind Direction Changes affect building pressures • Additional high resolution measurements • StickNet, KA Band Radar near surface wind characteristics • Pressure measurements on structures similar to hurricanes • Vertical wind speeds in tornadoes • Does it offset the strong horizontal wind speeds?
CONCLUSIONS/FUTURE WORK • Extreme thunderstorm events (9) studied for wind engineering purposes • High Variability (time series, time scales, WE parameters, vertical profiles) • Time Scales (~ 60 -200 seconds) • Current method not appropriate for analysis in thunderstorm areas • Likely “small scale” turbulence regimes not accounted for • Wind Engineering Parameters • Turbulence Intensity SBL, TS similar for prescribed averaging times with exception of V2 case • Gust Factor high variability, > 60 seconds no Durst Curve • Power Spectral Density periodic fluctuations evident, higher scale turbulence important to most structures similar • Events like V2 case need additional documentation and study • Vertical Profiles • Evolve over short time scales; maximum profiles highly variable • Peak on average lower the max measuring height
CONCLUSIONS/FUTURE WORK • Extreme thunderstorm events (9) studied for wind engineering purposes • Vertical Angle of Attack • No significant differences compared to SBL • May be different at higher above surface, tornadic cases • Building Effects • 3-s Cp mostly within range of SBL all in “critical areas” • Rapid increases in wind speed do not seem to alter aerodynamics • Rapid wind direction changes need study • Extreme Wind Speeds • Can be further enhanced with field programs to capture events of small temporal, spatial scales