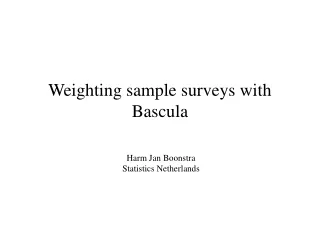
Sample Surveys
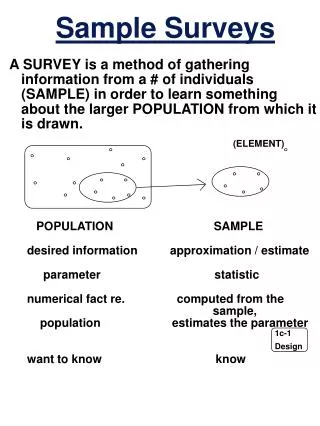
A SURVEY is a method of gathering information from a # of individuals (SAMPLE) in order to learn something about the larger POPULATION from which it is drawn. Sample Surveys. (ELEMENT). POPULATION SAMPLE desired information approximation / estimate

Sample Surveys
E N D
Presentation Transcript
A SURVEY is a method of gathering information from a # of individuals (SAMPLE) in order to learn something about the larger POPULATION from which it is drawn. Sample Surveys (ELEMENT) POPULATION SAMPLE desired information approximation / estimate parameter statistic numerical fact re. computed from the sample, population estimates the parameter want to know know
actual proportion of bank sample proportion of bank customers who closed of bank customers who their accounts because closed their accounts because they moved they moved actual proportion defective sample proportion defective parts output by a parts output by a manufacturing process manufacturing process (tires, airplane parts, …) Population vs. SampleandParameter vs. Statistic
Sample Surveys Marketing surveys Customer Satisfaction surveys Public Opinion polls Needle Exchange Program survey Child Immunization survey Alaska Airlines survey Customer Churn survey : : Other surveys
ELEMENT: entity upon which a measurement is made SAMPLING UNIT: collection of one or more elements. Each element should belong to exactly one sampling unit. SAMPLING FRAME: (should be) list of all sampling units in the population SELECTION BIAS: the systematic tendency on the part of the sampling procedure to exclude one kind of subject (sampling unit) or another from the sample NON-RESPONSE BIAS: bias due to nonresponders being characteristically different from responders A LARGE SAMPLE DOES NOT PROTECT AGAINST SELECTION BIAS !! !! !! !! !! Some Sampling Definitions
sample value = parameter value + error (estimate) = (desired information) + (error) error = chance error + bias causes for bias: - selection bias - non-response - many other causes Model for Estimationfrom a Sample Survey
mail: telephone: face-to-face interview: fax: e-mail: Types of Surveys
Probability versus Non-Probability Sampling: • subjects are selected randomly and according to pre-assigned selection probabilities Simple Random Sampling: • each subject (& group of subjects) is equally likely to be selected Stratified Sampling: • partition the population into subgroups (strata) • sample separately within each stratum • appropriately combine the information across strata Types of Sampling Procedures
Stratified Random Sampling: • stratify• take srs within each stratum Systematic Sampling: •sample every kth individual•example Quota Sampling: • fill pre-specified quotas• example Convenience Sample: Cluster Sampling: • select clusters of individuals• example: Current Population Survey Some More Types of Sampling Procedures
Table of Random Numbers 1 2 3 4 5 6 7 8 9 10 1 51449 39284 85527 67168 91284 19954 91166 70918 85957 19492 2 16144 56830 67507 97275 25982 69294 32841 20861 83114 12531 3 48145 48280 99481 13050 81818 25282 66466 24461 97021 21072 4 83780 48351 85422 42978 26088 17869 94245 26622 48318 73850 5 95329 84829 35103 91706 36834 05878 04514 30588 19239 7072 6 11179 69004 34273 36062 26234 58601 47159 82248 95968 99722 7 94631 52413 31524 02316 27661 15888 13525 43809 40014 30667 8 64275 10294 35027 25604 65695 36014 17988 02734 31732 29911 9 72125 19232 10782 30615 42005 90419 32447 53688 36125 28456 10 16463 42028 27927 48403 88963 79615 41218 43290 53618 68082
(1) Identify the problem; Set out the objectives (2) Select the sampling design & method (3) Design the questionnaire (4) Select the sample (5) Collect the data (6) Analyze the data Steps in Conducting a Survey
CBS COLLEGE PUBLISHING CBS Educational and ProfessionalPublishing A Division of CBS Inc 383 Madison Avenue New York New York 10017 (212)872-2000 October 10, 1986 Dear Professor: We are conducting a major market research study in the area Of Business Statistics. This study is being conducted nationwide Amoung a selected sample of all Business Statistics professors. For the results of this study to represent the opinions of all Business Statistics professors, it is vital that each questionnaire be completed and returned. Your ideas and opinions will help us develop texts designed to meet your course needs. Please take a few minutes to complete this brief survey. Thank you for your time. Sincerely, Eva M. Bronstein-Greenwald Manager of Market Research P.S. As a token of appreciation for your completed survey, we will send you a customized digital clock/bookmark if your completed survey is returned on or before November 21. Please fill in the enclosed mailing label and include it with your completed questionnaire. Holt, Rinehart and Winston Dryden Press, Saunders Coillege Publishing example cover letter
The following mail questionnaire was sent by a midwestern government organization to housewives in a large city. The basic purpose of the study was to gather information that would enable the organization to better advise housewives on purchasing food items and to advise manufacturers and retailers of changes needed in merchandising practices. Age of person filling out this form __________ Number of children now living at home __________ How many years experience buying food __________ For a family: More than 20 years __________ 5 to 20 years __________ Less than 5 years __________ Circle monthly take-home pay: Below $300.00 300.00 to 399.00 400.00 to 499.00 500.00 or over 1. How often do you buy canned fruits or vegetables? a. To serve as needed on a daily basis __________ b. A week’s supply at a time __________ c To maintain a stocked supply __________ d. Usually only when a store special is advertised __________ 2. Below in the left hand column are numbers used when can sizes are referred to. Match the numbers in column 2 with the correct can size. COLUMN: COLUMN 2: Co. 3 cylinder _____ 1. 16-17 oz. No. 303 _____ 2. 6 3/4 lb. No. 2 1/2 _____ 3. 20 oz. No. 2 _____ 4. 29 oz. No. 10 _____ 5. 46 oz. 3. Which measurement would you prefer to see on the can? Can size __________ Ounces __________ Servings __________ 4. Do you own a freezer? __________ How many cubic feet capacity? __________ 5. Of the money you spend on fruits and vegetables, what percentage goes for each of the following: Fresh for eating __________% Fresh for canning __________% Frozen __________% Canned __________% 6. Do you purchase canned fruits and vegetables by brand name? a. Always buy same brand __________ b. Strong preference for one brand __________ c. Preference, but occasionally buy other brand __________ d. No brand preference __________ 7. Do you ever buy HIGHEST quality? _______ For what purpose? __________________________________________________________ Do you ever buy HIGHEST quality? _______ For what purpose? __________________________________________________________ Example Questionnaire
8. What would be your advice to the young housewife starting out in homemaking concerning buying canned fruits and vegetables? How can she be sure the is buying a good quality product? 9. Where do you frequently buy canned fruits and vegetables? A and P _____ IGA _____ KOHL _____ KROGER-KRAMBO _____ NATIONAL _____ SENTRY _____ LOCAL STORE _____ INDEPENDENT _____ HALAN’S _____ 10. Rate the following names for quality. (1. Top quality, 2. Good, 3. Poor) _____Garden Fresh _____Avondale _____Sultana _____Ann Page _____ Old Time _____ Iona _____Serve U Rite _____ Kroger _____ Del Monte _____Natco _____Roundy’s _____ Ligbby’s 11. When you are buying canned foods, peaches for example, how important are each of the following to you? (Place X in column.) VERY NOT TOO IMPORTANT DESIRABLE IMPORTANT Firmness _____ _____ _____ Flavor _____ _____ _____ Color _____ _____ _____ Low percentage of _____ _____ _____ syrup or juice Odor _____ _____ _____ Food value _____ _____ _____ Uniform size _____ _____ _____ 12. What do the government grades A, B, C mean to you? ___________________________________ 13. Would you like such letter grades on all canned fruits and vegetables? Yes _____ No _____ 14. When can labels show suggestions for serving canned fruits or vegetables do you make use of them? Yes _____ No _____ 15. Rather than the serving suggestion, would you prefer to see recipes on the labels of canned fruits and vegetables? Yes _____ No _____ 16. Some foods are sold with an official grade on the package. Do you happen to recall how each of the following foods is sold? (Place X in column.) PACKAGE ALWAYS SOMETIMES NEVER SHOWS SHOWS SHOWS DON’T GRADE GRADE GRADE RECALL Butter _____ _____ _____ _____ Cheese _____ _____ _____ _____ Canned Tuna _____ _____ _____ _____ Hamburger _____ _____ _____ _____ Frozen Fish _____ _____ _____ _____ Canned Peas _____ _____ _____ _____ Fresh Apples _____ _____ _____ _____ Pork Loin Roast _____ _____ _____ _____ Canned Beets _____ _____ _____ _____ Eggs _____ _____ _____ _____ PLEASE RETURN THIS FORM IN THE STAMPED ADDRESSED ENVELOPE BY MAY 26. THANK YOU
• What is the PURPOSE OF THE STUDY ? • How was the STUDY DESIGNED (& implemented) ? • How were the DATA ANALYZED ? • Are the CONCLUSIONS backed by the data? . . . of appropriate generality? In considering a survey report:
Designed ExperimentversusObservational Study In a DESIGNED EXPERIMENT the investigator assigns experimental units to treatments. versus In an OBSERVATIONAL STUDY the investigator does not assign experimental units to treatments, but merely observes the treatments and the response on a set of experimental units.