Download
1 / 76
780 likes | 957 Vues
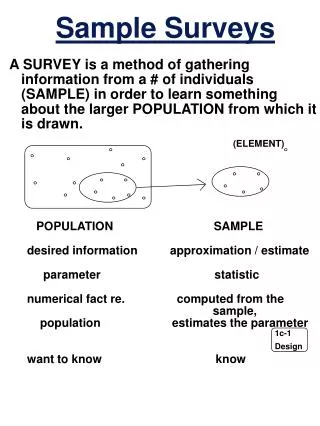
Combined use of data from registers and sample surveys. Eric Schulte Nordholt Statistics Netherlands Division Socio-economic and spatial statistics e.schultenordholt@cbs.nl Statistical Training Course on Use of Administrative Registers in Production of Statistics in Warsaw (October 2014).

E N D
Combined use of data from registers and sample surveys Eric Schulte Nordholt Statistics Netherlands Division Socio-economic and spatial statistics e.schultenordholt@cbs.nl Statistical Training Course on Use of Administrative Registers in Production of Statistics in Warsaw (October 2014)
Contents General • Social Statistics • System of social statistical datasets (SSD) • Group work on registers and surveys • The Dutch virtual census • Time for questions and discussion
Contents Social Statistics • Requirements for modern Social Statistics • Driving forces • Policy implications • Life cycle model • Relevant statistical information for policy and society • Strategy for data collection • Secondary data • How to get consistency of different data sources? • Prototype of a micro database • Conclusions
Requirements for modern Social Statistics • Product quality (Eurostat Code of Practice): • Relevance • Accuracy • Timeliness and punctuality • Comparability and coherence • Accessibility and clarity
Driving Forces • More coherence, more thematic publications, more detail (small areas, population groups) and more flexibility in the statistical output (will lead to a better product) • ICT developments: more registers • High nonresponse rates in social surveys • To cut down processing costs: standardisation • To lower response burden: less questions, EDI (or EDC) and diminish ‘irritation factor’
Policy implications • From primary to secondary data collection • Wherever possible use data available in existing registers and other administrative sources • Primary data collection only, if no (timely) data available (or of bad quality) • Statistics Netherlands Act • From traditional to electronic data collection • Standardisation of statistical processes; multi-data-source statistics; efficient sampling • Challenges must be faced while the available budget is constantly being reduced
Labour market position • Working/non • working • Occupation • Economic activity Labour market position Education Income • Demography • Year of birth • Nationality • Household • composition • Etc. Health Consumption Demography Housing Social capital Well-being Time use … Life cycle model (1)
Labour market position Education Income Health Consumption Social capital Demography Housing Well-being Time use … Life cycle model (2)
Time T+2 Cases T+1 T Variables Life cycle model (3)
Time Life cycle model (5) Analysis possibilities: • State • Transitions • between states • Duration time in • a certain state
Life cycle model (6) Time
Relevant statistical information for policy and society • Domain specific • Transitions and durations within a domain • Relations between domains • Relations between transitions and durations between domains • Monitor information (long period)
Strategy for data collection (1) • Start with registers (e.g. population register, housing register, business register) • Add data from other administrative sources • Add data from business and household surveys • Match all these data at the micro level • Create a ‘data clearing house’ within the statistical office
Variables Registers Surveys 1 . All inhabitants Netherlands . n Strategy for data collection (2)
RIN RIN Longitudinal Population Register Administrative or survey data Strategy for data collection (3) Matching method for individual data
Secondary data (1) • Quality • Quality may be good for some basic registers, but not for all registers; monitoring quality is important • No sampling errors • No unit nonresponse • Many sources of non-sampling errors remain: • Item nonresponse • Measurement errors • Coverage errors
Secondary data (2) • Challenges • Impact on the organisation, coordination, crossing departmental boundaries, change in culture • Influence of a statistical office on contents of registers is limited • Communication with register holders, e.g. about quality and changes • Quality control system (control surveys?) • Comprehensive, standardised metadata system • Version control system for updates • Changing form surveys to registers without causing a trend break
How to get consistency of different data sources? • Harmonisation! (coverage, definitions, reference periods, etc.) • Editing of all records at micro level by automated procedures • Only edit what needs to be edited (clear instructions are necessary!) • Make use of the technique of repeated weighting for survey data
Prototype of a micro database (1) X1…XK Y1…YM Z1…ZR U1…US LFS HS
Prototype of a micro database (2) Output inspired harmonisation: the one figure for one phenomenon idea StatLine: all statistical information on the web (via home page of Statistics Netherlands) http://www.cbs.nl/en-GB/menu/home/default.htm
Conclusions • Social Statistics develop in the direction of a • permanent virtual census to be able to • produce: • More crosstables over different domains • More longitudinal information • More flexible policy relevant output
Contents System of social statistical datasets (SSD) • Introduction to Statistics Netherlands • Examples of registers • Definition and driving forces of the SSD • The scope of the SSD • Core and satellites • The process • Linking the sources • Micro integration • Estimation aspects • Statistical confidentiality • Conclusions
Introduction to Statistics Netherlands (1) • The Central Statistical Office (CBS) • almost all official statistics in the Netherlands • no regional offices • two buildings: The Hague (in the West)
Introduction to Statistics Netherlands (2) • and Heerlen (in the South); both have about 1000 employees • Mission • The mission of Statistics Netherlands is to publish reliable and coherent statistical information that meets the needs of society. • Position of the Statistical Office • Statistics Netherlands is since 2004 a semi-independent organisation (still government funding) with about 2000 employees
Examples of registers • Three kinds of registers • Population Register (PR) • Job register • Self-employed register • Education register • Occupation register • Income register • Social security register • Unemployment register • Pension register • Other registers on persons, families and households • Housing register • Other registers on properties, buildings and dwellings • General business register • Other registers on enterprises and establishments • Common identifier: (numerical) address
Definition and driving forces of the SSD • Definition: • set of integrated microdata files with coherent and detailed demographic and socio-economic data on persons, households, jobs and benefits • No remaining internal conflicting information • Driving forces: • Virtual Census of 2001 • Better products: more coherence and flexibility
The scope of the SSD • All relevant variables in the life cycle • Demography • Health • Education • Labour market position • Income • Consumption • Housing • Time use • Etc.
Core and satellites (1) satellite satellite satellite satellite SSD-core satellite satellite satellite satellite
Core and satellites (2) • Core: • contains only integral register information • contains the most important demographic and socio-economic information • contains only information that is used in at least two satellites
Core and satellites (3) • Satellites are produced in two steps: • Copying and derivation of the relevant information from the core SSD • Adding of the unique information on a specific theme from registers and surveys
Core and satellites (4) • Examples of current SSD satellites: • Labour market • Social security • Income • Education • Health care • Justice and security • Ethnic minorities • Social cohesion • The development of more SSD-satellites has been planned
The process Already discussed: • Specify the information needed • Collection of registers • Surveys only additional Still to discuss: • Linking the sources • Micro integration • Estimation aspects • Statistical confidentiality
Linking the sources (1) • The Population Register is the backbone of the system for persons • All other files are matched exactly to the Population Register, • such that the true matches are maximised (aim: no missed matches) and the false matches (mismatches) are minimised
Linking the sources (2) • Matching variables: • Social security and fiscal (SOFI) number (effectiveness close to 100%), since 2007 Citizen Service Number • Other personal identifiers: sex, date of birth, and address (effectiveness close to 100%) • Number of mismatches very low (close to 0%)
Micro integration (1) The aim of micro integration is: • To check the linked data and modify incorrect records, • in such a way that the results that are to be published are of higher quality than the original sources
Micro integration (2) To fulfil this demand an integrated process of: • data editing, • derivation of statistical variables, • and imputation is executed
Micro integration (3) Constraints and limitations: • Only variables that are to be published are micro integrated • Identity rules are necessary, e.g. the same variable in two sources or a relationship between two or more variables in one or more sources • No mass imputation
Estimation aspects • Surveys are samples from the population • If surveys are enriched with register information, estimations of the register part of the enriched survey will lead to inconsistencies with the counts from the entire register • Statistics Netherlands developed the method of repeated weighting to solve these inconsistencies (aim: numerically consistent estimations)
Statistical confidentiality IDs Variables Characteristics Administrative sources Identifiers (PINs, sex, date of birth, address) IDsVariables Household surveys PERSONS BACKBONE full range of all persons as from 1995 IDs in sources are replaced by random Record Identification Numbers (RINs)
Conclusions • The SSD diminishes the administrative burden and increases: • The efficiency of statistics production • The accuracy of statistical outputs • The possibilities for social policy research • Safeguarding confidentiality is vital for the process of record linkage
Group work on registers and surveys (1) • Key question: which census variables are missing in all the registers? Consider the following thirteen census variables: • Sex • Age • Country of citizenship • Marital status • Household position • Religious denomination • Country of birth • Household size
Group work on registers and surveys (2) • Place of residence one year prior to the census • Economic status • Level of educational attainment • Occupation • Branch of current economic activity • A. Discuss the situation in the countries represented in your group or select some countries for further discussion
Group work on registers and surveys (3) • B. Are those missing variables available is any survey? Discuss where those surveys may be used (legal aspect and agreement with survey organiser) for producing official statistics • C. Can the surveys and registers be linked? Is this exact matching or is statistical matching necessary? • Are there other important issues that affect the overall situation?
Group work on registers and surveys (4) • D. Possibilities and limitations for further development of combining registers and surveys. What is the policy in the NSIs for further development? What are the possibilities and limitations for such a development? • E. Prepare a short presentation (5 minutes per group)
Contents The Dutch virtual census (1) • History of the Dutch Census • The Dutch Census of 2011 • Data sources • Combining sources: micro linkage • Combining sources: micro integration • Conditions facilitating use of administrative sources • Miscellaneous aspects • Census tables • Micro macro method • Result on 2011 economic activity
Contents The Dutch virtual census (2) • Comparison with other countries • Comparison with other years • Harmonisation • Microdata availability • Data integration activities between the 2001 Census and the 2011 Census • Preparing the 2011 Census • Conclusions
History of the Dutch Census (1) • TRADITIONAL CENSUS • Ministry of Home Affairs: • 1829, 1839, 1849, 1859, 1869, 1879 and 1889 • Statistics Netherlands: • 1899, 1909, 1920, 1930, 1947, 1960 and 1971 • Unwillingness (nonresponse) and reduction expenses no more traditional censuses
History of the Dutch Census (2) • ALTERNATIVE: VIRTUAL CENSUS • 1981 and 1991: limited virtual censuses based on Population Register and surveys • development 90’s: more registers → integrated set of registers and surveys, SSD • 2001 and 2011: complete virtual censuses based on the SSD with information at the municipality level
The Dutch Census of 2011 • is based on the Social Statistical Database (SSD) which • is a set of integrated microdata files with coherent and • detailed demographic and socio-economic data on • persons, households, jobs and benefits • has no remaining internal conflicting information • is part of the European Census • Eurostat: coordinator of EU, accession and EFTA • countries in the European Census Rounds • Census Table Programme, every 10 years • Social statistics in the Netherlands develop in the direction of a permanent Virtual Census to be able to produce: • More crosstables over different domains • More longitudinal information • More flexible policy relevant output