Download
1 / 44
440 likes | 453 Vues
This presentation discusses the challenges of data management and analysis from 2nd generation sequencing platforms, including the cost and time involved in sequencing the human genome, variety of approaches towards ULCS methods, and novel methods for genome sequencing.

E N D
Challenges of data management and analysis from 2nd generation sequencing platforms October 10 2006
Challenges of data management and analysis from 2nd generation sequencing platforms October 10 2006
Presenters • Colin Hercus • 25 mer mapping • Zayed Albertyn • 100 mer & polony mapping
Personal Genome and Personalised medicine The Human Genome 3 billion “pieces” – in every cell.. First Genome took 16yrs Cost US$3 billion Late 2006-2007 New technologies emerging.. Cost: US$1000 Time: 1 day!
Personal Genome and Personalised medicine The Human Genome 3 billion “pieces” – in every cell.. First Genome took 16yrs Cost US$3 billion Late 2006-2007 New technologies emerging.. Cost: US$1000 Time: 1 day!
Graphical Interface COREDatabase platform Data analysis Develop Tools Command line interface SXParse SynaSearch Bulk SXSequenceRefs SynaRex Bulk SXLRESearch SynaProbe Bulk SXFuzzyPatternSearch SynaMer Sxpet SynaFrag Another 20+ apps
Similarity & association Common PATTERNS and functionality What do we know about data ?
ATG GAA AAT ATG TGA CAT TGC GCA CATG ATGC TGCA GCAT ATGCA TGCAT A T G C A T G A A T…… A T G C AA AT AT AT GA TG TG CA GC
Q* logN base A Speed milliseconds 900 800 Conventional 700 600 SynaBASE 500 400 300 200 100 Size of database 1 10 100 1000
3 yrs Case Study - Comparison of Human v Mouse genome 22days 6h SynaBASE PatternHunter BLAST
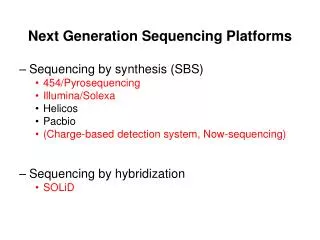
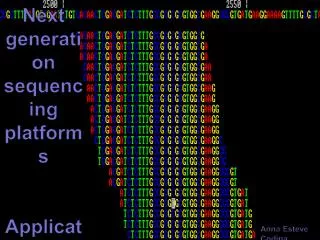
Read mapping • Variety of novel methods for genome sequencing • Shorter reads with higher coverage • 25mers - Solexa • 100-200mers – 454 • Polony reads • Larger volumes of sequence data • Error rates much higher than Sanger method • Computationally Intractable for conventional bioinformatics applications
Mapping 25mers Mapping 25 mers • SynaBASE API method SXSSASearch() can be used to rapidly map short oligos to a genome using un-gapped alignments • Suitable for finding substitution differences but not insert/delete differences • Gapped alignment of short oligos using a modified version of the SXSSASearch() method • SXSSASearch: • does not use heuristics and is guaranteed to find all matches to an oligo given the scoring matrix and a threshold • uses a weight matrix with position dependent scores for each base # SXOligoSearch # Thu Sep 14 16:22:07 2006 # $Id: SXOligoSearch.cpp,v 1.28 2006/07/17 07:31:57 Exp $ # SXOligoSearch chr22 dummy.txt >Read-0:21200326 AAGTAGCCAAGAGCATGCCC .........T.......... + chr22:21200327-21200346 20 >Read-1:21200835 GTCTCCACAAGAAAATACAA .................... + chr22:21200836-21200855 20 >Read-2:21200982 TGTATTCTGCAGAACTGATA ...C..........G..... + chr22:21200983-21201002 20
Very fast and flexible approach Mapping 25 mers • Example: 350,000 reads can be mapped in 125sec - 3 per ms • Makes approach suitable for reads that have varying quality over their length • Mismatch penalty can be reduced towards the 3’ end of reads Quality or Probability of being correct 1.0 0 25
Mismatches and quality scores Mapping 25 mers • If a read maps to 2 locations: • One with a mismatch in the low quality 3’ end and one with a mismatch near the 5’ end. The position of the mismatch and quality should be taken into account when selecting the best mapping and for SNP qualification • In the example above the first reported alignment would likely be taken as the correct one as the mismatch is in a low quality base • To optimize performance the search process starts by searching for an exact match and the threshold is increased until at least one match is found • If a read maps to multiple locations then it may be from a repeat and may be ignored when determining putative SNPs
Finding SNPs I Mapping 25 mers • SNP identification should take into account: • Known SNPs • Whether the species is Haploid, Diploid, etc. • Quality of reads by base position • Background SNP rate • If the SNP is within a documented exon, then translation neutral SNPs can be distinguished • Example 1: the reads all have a mismatch corresponding to the same position in the genome indicating a possible SNP
Finding SNPs II • Example 2: One read has a mismatch and two reads match • The mismatch corresponds to a low quality base position in the read so the mismatch could be interpreted as insignificant and not reported. • If the species is diploid and it is known from a SNP library that some individuals carry a SNP for a ‘C’ at this position. In this case there is an increased probability of this individual carrying the SNP on one of the two chromosome copies. • Some SNPs cause disease only if they exist in both copies of the chromosome while others can cause disease even if only one copy carries the SNP
Summary Mapping 25 mers • Mapping of short reads achieved at very high throughput – less than 1ms • Position specific scoring allows variable quality reads to be mapped • Statistical analysis of mismatches to qualify SNPs
Mapping 120 mers MultiPass Strategy for Mapping Sequence data to Genomes using SynaBASE Analysis Steps Search 4% mutated reads against the Human genome SynaBASE using high stringency parameters 1st Pass SynaSearch matches ~61 % on first pass Repeat the search by reducing filter score to identify shorter alignments e.g. score < 30 2nd Pass Reduce repeat filtering stringency 3rd Pass
Input Sequence Reads: ~ 1.7 million @ 6X coverage of Hs chr22 Mapping 120 mers
Mapping 120 mers
Analysis of Results Mapping 120 mers • View read placement along chromosome • Calculate mapping efficiency • 1.7m reads mapped to human genome in 53 min 22 seconds
Simulation Mapping Results Mapping 120 mers
Chr22 mapping overview Mapping 120 mers Read Density Count Chr22 sequence position Red – forward Green – Reverse complement
Human Chr2 Mapping 120 mers Read Density Count Chr2 sequence position Red – forward Green – Reverse complement
Viewing Results Mapping 120 mers • Gbrowse: Community-based system to view results • Numerous customisations to show sequence coverage • Analyze read mappings in the context of • Known genes • Repeats and variations (SNP) • Comparative genomics
Mapping 120 mers
RAB36 RAS Oncogene Family on chromosome 22 Mapping 120 mers
Mapping 120 mers Areas of lower read coverage
Conclusions Mapping 120 mers • Very significant performance improvements compared to MegaBLAST – <100ms per read • Very high coverage attained by using multi-pass strategy • Over 95% coverage • Remaining 5% are repeats • High specificity – less matches per read • Enables multiple human genomes to be processed per day
Mapping Polony reads 5 mers
Polony sequencing read mapping 5 mers polony reads • Convert genomic sequences to spectra • Sample random probe sets from random chromosomal regions • Filter probe sets using probe intensity spectra • Query probe sets against genome database
Reference Database Generation Probe set Generation Sample probe intensities from spectra using normal distribution (Mean 2000 / SD 250) Sequence to spectrum conversion using 512 bit translation Sequence to spectrum conversion using 512 bit translation Simulate error rates at 1-7% in probe sequence Build SynaBASE for querying with probe sets Generate 10,000 random 200bp reads from Hs chr22 Generate Overlapping segments for Hs chr22 @ 5X Coverage Method Verification Filter probes based on intensity thresholds for each error rate Alignment search remainder of probes against reference SynaBASE of Hs chr22 Analyze score and % identities for all probe sets at various intensity thresholds
Overall 5 mers polony reads
Advantages 5 mers polony reads • Time taken to conduct 0% to 4% searches – around 6ms • Enhanced performance to the SynaBASE engine & associated algorithms • 100% hits matched for 1-3 % error margin data • ~15 million searches against a reference genome in 1 day
Summary • SynaBASE used as database PLATFORM • Unique, leads to massive increases in speed and scalability • Applied to the 3 main classes of reads from 2nd generation sequencing platforms • 100s of fold faster than conventional approaches • Specificity and accuracy enhanced due to exhaustive nature of SynaBASE
Thank you Please email questions to: enquiries@synamatix.com