1 / 7

Comparison of some results

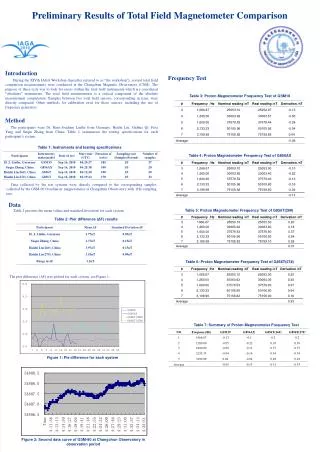
This report presents a detailed comparison of critical financial metrics between the USA, Australia, and Nordic countries. It examines turnaround times, fill rates, unit costs, borrowing costs, lending cost structures, and various cost categories. The analysis aims to identify differences and trends in financial performance across these regions, providing insights into operational efficiencies and effective cost management strategies. The findings are based on data collected until October 2002, with a focus on informing stakeholders in the financial sector.

anja
Télécharger la présentation

Comparison of some results

An Image/Link below is provided (as is) to download presentation Download Policy: Content on the Website is provided to you AS IS for your information and personal use and may not be sold / licensed / shared on other websites without getting consent from its author. Content is provided to you AS IS for your information and personal use only. Download presentation by click this link. While downloading, if for some reason you are not able to download a presentation, the publisher may have deleted the file from their server. During download, if you can't get a presentation, the file might be deleted by the publisher.

E N D

Presentation Transcript


  1. Comparison of some results USA – Australia – Nordic Countries Reykjavik 5.10.2002

  2. Volume / FTE

  3. Turnaround time

  4. Fill rate

  5. Unit costs

  6. Cost categories / borrowing

  7. Cost structure / lending

More Related