Download
1 / 30
300 likes | 433 Vues
Statistical Significance of Sequence Comparison Results. OUTLINE. Scoring Matrices Probability of matching runs Quality of a database match. Scoring Matrices. Two alternative models for differences in DNA / protein sequences Random:

E N D
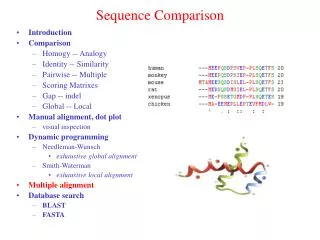
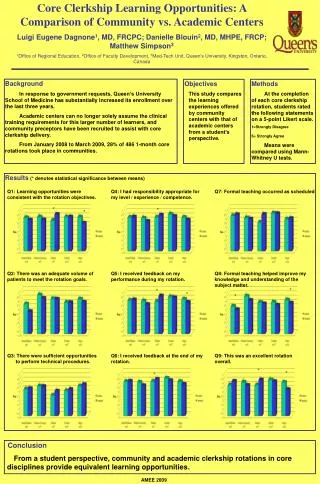
Statistical Significance of Sequence Comparison Results
OUTLINE • Scoring Matrices • Probability of matching runs • Quality of a database match
Scoring Matrices • Two alternative models for differences in DNA / protein sequences • Random: • All sequences are random selections of given pool of residues. • Nonrandom: • Sequences are related, • Evolutionary process.
Scoring Matrices • Random: • pa: fraction of amino acid a in the pool (probbility of occurance of the amino acid). • Nonrandom: • qa,b: the probability of finding particular residus a and b aligned
Scoring Matrices • These two models can be compared: • qa,b / pa pb odds ration • If qa,b > pa pb nonrondom model is more likely to produce the alignement of these residues.
Scoring Matrices • However, we need a single model • Assume: each position in an alignment will be regarded as independent. • Odds ratio of alignment:
Scoring Matrices • log – odds ratio: • Negative value: probability of the two residues aligned is greater in the random model than nonrandom model.
Scoring Matrices • EXAMPLE: If M occurs in the sequences with 0.01 frequency and L occurs with 0.1 frequency. By random pairing, you expect 0.001 amino acid pairs to be M-L. If the observed frequency of M-L is actually 0.003, score of matching M-L will be log2(3)=1.585
Probability of matching runs • Statistical significance measures: • p-value: the probability that at least one sequence willproduce the same score by chance • E-value: expected number of sequences that willproduce same or better score by chance
Probability of matching runs • Analysis of coin tosses : • “H” indicates a head • p probability of head (p = 0,5) • Probability of 5 heads in a run: 0,55=0,031 • The expected number of times that 5H occurs in above 14 coin tosses: 10x0,031 = 0,31
Probability of matching runs • Analysis of coin tosses : • The expected number of a length l run of heads in n tosses: • Expected length R of the longest match in n tosses: (Erdös-Rényi)
Probability of matching runs • Analysis of coin tosses : • Example: • N = 20 R = log2(20) = 4,3 (in 20 coin tosses we expect 4,3 runs of heads, once )
Probability of matching runs • DNA / protein sequences: • Probability of an individual match p = 1 / 20 = 0,05
Probability of matching runs • Expected number of matches: • 8x6x0.05 = 2,4
Probability of matching runs • Expected number of two successive matches: • 8x6x0,05x0,05 = 0,12
Probability of matching runs • Expected number of length l matches: • Expected longest match of two sequences of length m and n: where p is the probability of occurance of a single residue.
Probability of matching runs • Expected number of length l matches: • Expected longest match of two sequences of length m and n: where p is the probability of occurance of a single residue.
Probability of matching runs • Example: • DNA seq: m = 32, n = 32 R = log4(32x32) = 5 • Amino acid seq: m = 100, n = 80 R = log20(100x80) = 3
Probability of matching runs • Under even the simplest random models and scoring systems, very little is known about the random distribution of optimal global alignment scores • Statistics for the scores of local alignments, unlike those of global alignments, are well understood.
Probability of matching runs • The optimal ungapped local alignment score follows the Gumble Extreme value distribution. • Because we always choose the best-scoring alignments the distribution will be Gumble Extreme value distribution. • Probability of obtaining an alignment of score S greater than a value x:
Quality of a database match • How good is an alignment ? • How believable the results of a database search ?
Quality of a database match • The alignment reports are selected according to the alignment score. • We need to know: • Whether the score is greater than we would expect from the alignment of the sequences with a random sequence.
Quality of a database match • Statistical significance measures: • p-value: the probability that at least one sequence willproduce the same score by chance • E-value: expected number of sequences that willproduce same or better score by chance
Quality of a database match • Score Significance of the score. • By applying the Gumble Extreme value distribution, it is possible to estimate the probability of two random sequences aligned with a score greater than or equal to the alignment score. • E- value, p – value.
Quality of a database match • E-value depends on: • The sequence length, • The number of sequences in the database, • Alignement score.
Quality of a database match • A good E-value: • The smaller the E-value the better the alignment, • The threshold value generally is set to 0,01 or 0,001.
References • M. Zvelebil, J. O. Baum, “Understanding Bioinformatics”, 2008, Garland Science • Andreas D. Baxevanis, B.F. Francis Ouellette, “Bioinformatics: A practical guide to the analysis of genes and proteins”, 2001, Wiley.