Download

1 / 41
410 likes | 645 Vues
Statistical Significance. How did it all started Fisher’s p or Type I Error Pearson’s statistical significance Where are we heading. Statistical Significance. How did it all started From havara to the normal distribution From Standard Deviation to the Standard Error of the difference

E N D
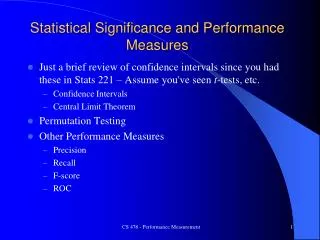
Statistical Significance • How did it all started • Fisher’s p or Type I Error • Pearson’s statistical significance • Where are we heading
Statistical Significance • How did it all started • From havara to the normal distribution • From Standard Deviation to the Standard Error of the difference • Fisher’s p or Type I Error • Pearson’s statistical significance • Where are we heading
Mean • Havara : a system of insurance amongst Phoenecian traders • Havara -> average -> mean • Mean is the centre of all the measurements
Gauss De Moivre
De Moivre Fisher
Statistical Significance • How did it all started • From havara to the normal distribution • From Standard Deviation to the Standard Error of the difference • Fisher’s p or Type I Error • Pearson’s statistical significance • Where are we heading
Measurements • Mean : central tendency of measurements • Standard Deviation : variability of measurements • Mean • Sample mean : an estimate of population mean • Standard Error of the mean : the Standard Deviation of repeated estimates of the mean • Difference in means between 2 groups • Difference between two sample means : an estimate of the difference between two groups in the population • Standard Error of the difference : The standard Deviation of repeated estimates of the difference
Fisher’s p • How did it all started • Fisher’s p or Type I Error • The problem at hand • To prove or to disprove • The null hypothesis, Type I Error, and Fisher’s p • The strengths and weaknesses of Fisher’s p • Pearson’s statistical significance • Where are we heading
Fisher’s time (1890-1962) • Much of Fisher’s work was between 1930 and 1950 • The industrial revolution was in full swing, the empire was at its zenith • Need for massive increase in agriculture and manufacturing • Although considerable knowledge and expertise already existed, there was a great need on how to improve things
Optimism in the power of science • Eugenics • Selective breeding can improve agricultural produce, livestock, and even human race • Agriculture • Use of insecticides and fertilisers can improve yields in plants • Different feeding and environmental conditions can improve quality of livestock • Manufacturing • Productivity can be improved by machinery and different organisation of work
The research needs • The need • To find out if a now method of doing things would improve outcome to the extent that it is worth adopting • The problem • The obvious have already been observed • Outcome often influenced by many factors, the new method of doing thing is but one of these. • A new method or procedure would not have the same effect on every case, even if it is better overall
Statistical Significance • How did it all started • Fisher’s p or Type I Error • The problem at hand • To prove or to disprove • The null hypothesis, Type I Error, and Fisher’s p • The strengths and weaknesses of Fisher’s p • Pearson’s statistical significance • Where are we heading
Mathematics • Mathematicians think that • It is not possible to define something as true, as one has to demonstrate it is true under all conceivable and potential circumstances • It is easy to define something as not true because all it takes is a single instance of it not being true to be right • Mathematical proof • Describe a hypothesis, and reject it (say it is wrong) • Research (data, logic, or both) to falsify (disprove) the rejection (to disprove that the hypothesis is wrong) • The hypothesis can no longer be rejected if rejection is shown to be wrong (in error)
Statistical Significance • How did it all started • Fisher’s p or Type I Error • The problem at hand • To prove or to disprove • The null hypothesis, Type I Error, and Fisher’s p • The strengths and weaknesses of Fisher’s p • Pearson’s statistical significance • Where are we heading
Fisher was a mathematician • Fisher’s logic for an experiment • The hypothesis is that a new treatment does not work, that it makes no difference. He called this the null hypothesis. This hypothesis is then rejected • The purpose of the experiment is to show that this rejection is wrong, that the rejection is an error (type I Error) • If the experiment shows that type I error exists, then it is wrong to reject the null hypothesis, and the null hypothesis stands • If the experiment failed to show that Type I Error exists, then the null hypothesis can be safely rejected, the new treatment can be accepted as working and used.
Statistical representation • The error in rejecting the null hypothesis can not be determined in absolute terms • A new treatment will work in some cases and not others • All measurements have variations • There are multiple influences on outcome • So overlaps therefore exists • Fisher devised a method of estimating the probability of error in rejecting the null hypothesis. This is commonly referred to as Fisher’s p.
The null hypothesis and Fisher’s p • The hypothesis : the true difference between two groups under examination is null. This is rejected • Given that the experiment consists of taking samples, the null value is only the mean, and the Standard Error is as estimated from the sample • The probability of Type I error is measured by the area under the normal distribution curve outside of the difference found. • The probability of Type I error is therefore • Formally known as the probability of error in rejecting the null hypothesis when the null hypothesis is true • Commonly abbreviated as Fisher’s p, and symbolised alpha • Logically means the probability that the real difference is zero • The smaller the p the more likely that a true difference exists
Statistical Significance • How did it all started • Fisher’s p or Type I Error • The problem at hand • To prove or to disprove • The null hypothesis, Type I Error, and Fisher’s p • The strengths and weaknesses of Fisher’s p • Pearson’s statistical significance • Where are we heading
Advantages of using Fisher’s p • It measures the probability of error in rejecting the null hypothesis when it is true, therefore • How likely that two groups are the same • How likely a new treatment makes no difference • It provides confidence to decisions • It underwrites scientific developments and improvements in agriculture and manufacturing that was the basis of western wealth and power in the last century
Disadvantages of Fisher’s p • It is sample size dependent. • The larger the sample, the smaller the SE, the smaller the p for any difference found • It provides a measurement of confidence to a conclusion, but is itself not the conclusion • It estimate the error of rejecting the null hypothesis, but not that of accepting it. • No conclusion can be drawn if p is large
Statistical Significance • How did it all started • Fisher’s p or Type I Error • Pearson’s statistical significance • The Alternative hypothesis and Type II Error • The practical difficulties and their resolution • Pearson’s statistical significance • The strengths and weaknesses • Where are we heading
Who was Pearson • Fisher and Karl Pearson were the pioneers of statistics, in Cambridge and London • Karl Pearson’s son Egon Pearson was also a statistician • It was Egon Pearson who developed the idea of the Type II Error
Pearson’s Type II Error • Fisher’s p is insufficient • It estimates the probability of error in rejecting the null hypothesis, but not in the acceptance of it. Information is therefore incomplete for decision making • The alternative hypothesis to reject • A hypothesis that a difference between the groups does exist, with the same Standard error of the mean. • From this the probability of error to reject the alternative hypothesis can also be estimated (Type II Error) • The errors of rejecting and accepting the null hypothesis are both necessary to draw a statistical conclusion
Type II error • Type II error • The error of rejecting the alternative hypothesis when the alternative hypothesis is true • The probability of Type II error • The probability of error to reject the alternative hypothesis when the alternative hypothesis is true • The probability of error in accepting the null hypothesis when the null hypothesis is false • Commonly symbolised as beta • Commonly used in the reverse as power = 1 - beta • Fisher’s p and power provides the confidence to statistical conclusions • Fisher’s p represents the confidence to conclude that there is no difference • Power represents the confidence to conclude that there is a difference
Statistical Significance • How did it all started • Fisher’s p or Type I Error • Pearson’s statistical significance • The Alternative hypothesis and Type II Error • The practical difficulties and their resolution • Pearson’s statistical significance • The strengths and weaknesses • Where are we heading
Problem with the alternative hypothesis • There is no logical or practical way to define what a hypothetical difference should be • Null is easy, as it is a special value • The value of the mean for the alternative hypothesis is unknown. If arbitrarily assigned it effects the estimation of Type II error • The hypothesis is elegant and logical, but difficult to implement
Recasting of the alternative hypothesis • Recasting the mean • The probability of error is calculated from the mean the Standard Error, and the deviate z • The mean can therefore be calculated from the probability, Standard Error, and z • Recasting the Standard Error • Standard Error is calculated from the Standard Deviation and sample size • Sample size can therefore be calculated from the Standard Deviation and the Standard Error
Recasting of the alternative hypothesis • If • The probability of Type I Error that we will use for decision making can be assigned (say alpha = 0.05) • The probability of Type II error for decision making can be assigned (say beta = 0.2 or power = 0.8) • The Standard Deviation of the measurements used can be estimated • The difference that is of practical importance is assigned as the mean of the alternative hypothesis • Then • We can calculate the sample size required to complete the study • A critical value for the difference can be calculated that will satisfy all the conditions • At the end of data collection • If the difference between means is less than the critical value, we declare the difference not significant • If the difference is greater than the critical value, we declare it significant
Statistical Significance • How did it all started • Fisher’s p or Type I Error • Pearson’s statistical significance • The Alternative hypothesis and Type II Error • The practical difficulties and their resolution • Pearson’s statistical significance • The strengths and weaknesses • Where are we heading
Statistical Significance • How did it all started • Fisher’s p or Type I Error • Pearson’s statistical significance • The Alternative hypothesis and Type II Error • The practical difficulties and their resolution • Pearson’s statistical significance • The strengths and weaknesses • Where are we heading
Strength of statistical significance • It is user friendly • It allows a binary decision of whether something is true or not true • It allows the estimation of sample size • Reduces waste of resources and excessive risks • Avoids trivial but statistically significant difference from massive sample size • Assists planning and evaluation of resource requirement • Assists in the evaluation of whether the study has adequate size to draw the necessary conclusions
Weaknesses of statistical significance • Model is invalid if the assumptions are not accurate • Variations (Standard Deviation) during research is often reduced because of greater uniformity of case selection and observation of protocols • Difference between groups is often reduced because of the Hawthorn Effect
Weaknesses of statistical significance • Model is easily misinterpreted or abused • Mixing of statistical significance and Fisher’s p • Over-riding the critical value if p<0.05 when the SD of the samples are less than assigned • Over-riding of the critical value if p>0.05 when the SD of the samples are larger than that assigned • Assigning of inappropriate SD that do not reflect population variance, or a critical value for difference in means that do not reflect practical importance • Artificially assigning a small SD or a large difference to manipulate the sample size required
Statistical Significance • How did it all started • Fisher’s p or Type I Error • Pearson’s statistical significance • Where are we heading
1930 - 1980 • Dominated by the use of Fisher’s p • Model suited to agricultural and industrial research • Main concern is whether to estimate whether a new method or practice is better, and whether it is worthwhile to invest the time and effort to change
1970 - now • Increasing use of statistical significance • Increasing needs of social, economic and medical research, to decide whether something is true or not • Increasing needs of research planning, resource and risk considerations • Increasing needs of supervisory and grant giving bodies to have an objective method of allocating resources and to audit progress • Increasing demands of journal editors to separate real results from spurious ones arising from inadequate sample size
1990 - now • Increasing awareness of the inadequacies of current statistical models • Fisher’s model too sample size dependent • Pearson’s model involved too many arbitrary decisions, and vulnerable to misinterpretations and abuse, so results do not stand the test of time • Compensation for inadequacies • Post hoc power analysis to ensure that the model is indeed appropriate • Meta-analysis, a partial return to Fisher’s p (evidence based practice) • Newer approaches • Confidence intervals. A return to Fisher’s p without the problems • Bayesian probability, how our perception of truth can be altered by research observations
In the meantime • The Pearson model is used for planning, particularly for sample size estimation • The concept of statistical significance is increasing replaced by meta-analysis • Statistical decisions, particularly in social and medical research, where the research models are relatively simple, are increasingly based on confidence intervals • Fisher’s p is still used extensively in laboratory, agricultural, and industrial research