Statistical Significance
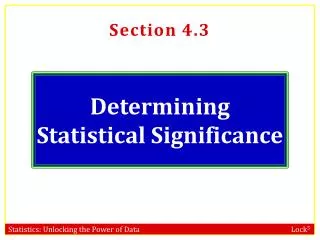
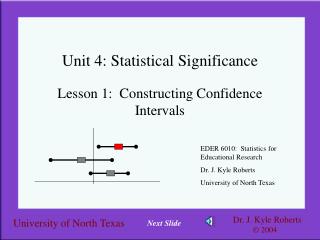
Statistical Significance. R.Raveendran. Why should we test significance?. Heart rate (bpm) Mean ± SEM n In men - 73.34 ± 5.82 10 In women - 80.45 ± 6.13 10 The difference between means (80.45-73.34) = 7.11


Statistical Significance
E N D
Presentation Transcript
Statistical Significance R.Raveendran
Why should we test significance? • Heart rate (bpm) Mean ± SEM n • In men - 73.34 ± 5.82 10 • In women - 80.45 ± 6.13 10 • The difference between means (80.45-73.34) = 7.11 • We do not need a stat test of significance, if only : • a. the data from all subjects in a group are IDENTICAL • b. we can collect data from all subjects in a population
Why should we test significance? We test SAMPLE to draw conclusions about POPULATION If two SAMPLES (group means) are different, can we be certain that POPULATIONS (from which the samples were drawn) are also different? Is the difference obtained TRUE or SPURIOUS? Will another set of samples be also different? What are the chances that the difference obtained is spurious? The above questions can be answered by STAT TEST.
Stat test Tests whether two groups are statisticallydifferent from each other Statistically different? = Truly different? Not just apparently different You do not need statistics to say these two are truly different. Do you?
But statistics does help us determine which group of trees is taller You do not need statistics to say these two are truly different. Do you?
How does a Stat test work? • Stat test analyses the data (numbers) submitted (by the researcher) to calculate the chances of obtaining a difference when there is none i.e. probability of obtaining a spurious difference. • It does not indicate • whether your design is right or wrong • whether the type of data is correct or wrong • (c) the magnitude of the difference • (d) whether the difference will be practically useful • All it can point out is whether the obtained difference between two groups is REAL or FALSE
What does a Stat test infer? Stat test Data P value When p<0.05, it shows that the chances of obtaining a false difference is less than 5% (1 in 20) [p<0.01 – 1 in 100; p<0.001 – 1 in 1000] Since we consider 5% P is small, we conclude that the difference between groups is TRUE Truth is something which is most likely to be true and 100% certainty is impossible.
How to test statistical significance? State Null hypothesis Set alpha (level of significance) Identify the variables to be analysed Identify the groups to be compared Choose a test Calculate the test statistic Find out the P value Interpret the P value Calculate the CI of the difference Calculate Power if required
Null hypothesis Null hypothesis (statistical hypothesis) states that there is no difference between groups compared. Alternative hypothesis or research hypothesis states that there is a difference between groups. e.g. New drug ‘X’ is an analgesic - (Research hypothesis) New drug ‘X’ is not an analgesic – (Null hypothesis)
Alpha / type 1 error / level of significance The level of significance is to be set It is generally set at 0.05 (5%) and not above. If the P value is less than this limit then null hypothesis is rejected i.e. the difference between groups is not due to chance.
Choosing a stat test Why should we choose a test?
Choosing a stat test………. • Why should we choose a test? • There are many tests • The selection of test varies with the type of • data, • analysis, • study design, • distribution & • no. of groups
Choosing a stat test…… Determine : Aim of the study – Parameter to be analysed - Data type- [Continuous, Discrete, Rank, Score, Binomial] Analysis type- [Comparison of means, Quantify association, Regression analysis] No. of groups to be analysed - No. of data sets to be analysed - Distribution of data - [normal or non-normal] Design - [paired or unpaired] With the above information, one can decide the suitable test using the table given.
Choosing a stat test…… • Data type 2. Distribution of data 3. Analysis type (goal) • 4. No. of groups 5. Design Table downloaded from www.graphpad.com
Calculating test statistic difference between group means variability of groups XT - XC e.g. t test t = SE(XT - XC) • Determining P • Find out the degrees of freedom (df) • Use t and df to find out P using a formula or ‘critical values table’
How to interpret P? If P < alpha (0.05), the difference is statistically significant If P>alpha, the difference between groups is not statistically significant / the difference could not be detected. If P> alpha, calculate the power If power < 80% - The difference could not be detected; repeat the study with more ‘n’ If power ≥ 80 % - The difference between groups is not statistically significant.
Degrees of Freedom It denotes the number of samples that a researcher has freedom to choose. The concept can be explained by an analogy : X + Y = 10 df = 1 X+ Y+Z = 15 df = 2 For paired t test df = n-1 For unpaired t test df= N1+N2 - 1