Statistical significance
Analytic Decisions. P-values. Statistical significance. Where we are:. Thus far we’ve covered: Measures of Central Tendency Measures of Variability Z-scores Frequency Distributions Graphing/Plotting data All of the above are used to describe individual variables


Statistical significance
E N D
Presentation Transcript
Analytic Decisions P-values Statistical significance
Where we are: • Thus far we’ve covered: • Measures of Central Tendency • Measures of Variability • Z-scores • Frequency Distributions • Graphing/Plotting data • All of the above are used to describe individual variables • Tonight we begin to look into analyzing the relationship between two variables
However… • As soon as we begin analyzing relationships, we have to discuss ‘statistical significance’, RSE, p-values, and hypothesis testing • Descriptive statistics do NOT require such things, as we are not ‘testing’ theories about the data, only exploring • You aren’t trying to ‘prove’ something with descriptive statistics, just ‘show’ something • These next few slides are critical to your understanding of the rest of the course– please stop me for questions!
Hypotheses • Hypothesis - the prediction about what will happen during an experiment or observational study, or what researchers will find. • Examples: • Drug X will lower blood pressure • Smoking will increase the risk of cancer • Lowering ticket prices will increase event attendance • Wide receivers can run faster than linemen
Hypotheses • Example: Wide receivers can run faster than linemen • However, keep in mind that our hypothesis might be wrong – and the opposite might be true: • Wide receivers can NOT run faster than linemen • So, each time we investigate a single hypothesis, we actually test two, competing hypotheses.
Hypothesis testing • HA: Wide receivers can run faster than linemen • This is what we expect to be true • This is the alternative hypothesis (HA) • HO: Wide receivers can NOT run faster than linemen • This is the hypothesis we have to prove wrong – before our real hypothesis can be correct • The default hypothesis • This is the null hypothesis (HO)
Hypothesis Testing • Every time you run a statistical analysis (excluding descriptive statistics), you are trying to reject a null hypothesis • Could be very specific: • Men taking Lipitor will have a lower LDL cholesterol after 6 weeks compared to men not taking Lipitor • Men taking Lipitor will have a similar LDL cholesterol after 6 weeks compared to men not taking Lipitor (no difference) • …or very simple (and non-directional): • There is an association between smoking and cancer • These is not an association between smoking and cancer
Why null vs alternative? • All statistical tests boil down to… HO vs. HA • We write and test our hypothesis in this ‘competing’ fashion for several reasons, one is to address the issue of random sampling error (RSE)
Random Sampling Error • Remember RSE? • Because the group you sampled does NOT EXACTLY represent the population you sampled from (by chance/accident) • Red blocks vs Green blocks • Always have a chance of RSE • All statistical tests provide you with the probability that sampling error has occurred in that test • The odds that you are seeing something due to chance (RSE) vs • The odds you are seeing something real (a real association or real difference between groups)
Summary so far… • #1- Each time we use a statistical test, there are two competing hypotheses • HO: Null Hypothesis • HA: Alternative Hypothesis • #2- Each time we use a statistical test, we have to consider random sampling error • The result is due to random chance (RSE, bad sample) • The result is due to a real difference or association These two things, #1 and #2, are interconnected and we have to consider potential errors in our decision making
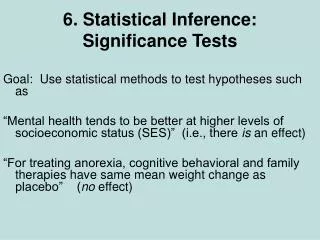
Examples of Competing Hypotheses and Error • Suppose we collected data on risk of death and smoking • We generate our hypotheses: • HA: Smoking increases risk of death • HO: Smoking does not increase risk of death • Now we go and run our statistical test on our hypotheses and need to make a final decision about them • But, due to RSE, there are two potential errors we could make
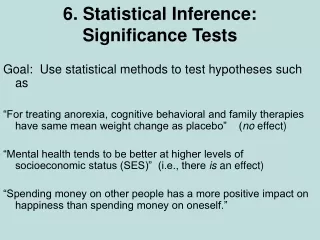
Error… • There are two possible errors: • Type I Error • We could reject the null hypothesis although it was really true • HA: Smoking increases risk of death (FALSE) • HO: Smoking does not increase risk of death (TRUE) • This error led to unwarranted changes. We went around telling everyone to stop smoking even though it didn’t really harm them OR…
Error… • Type II Error • We could fail to reject the null hypothesis when it was really untrue • HA: Smoking increases risk of death (TRUE) • HO: Smoking does not increase risk of death (FALSE) • This error led to inaction against a preventable outcome (keeping the status quo). We went around telling everyone to keeping smoking while it killed them OR…
HA: Smoking increases risk of death • HO: Smoking does not increase risk of death 1 2 3 4 Questions…?
Random Sampling error Kent Brockman: Mr. Simpson, how do you respond to the charges that petty vandalism such as graffiti is down eighty percent, while heavy sack beatings are up a shocking nine hundred percent? Homer Simpson: Aw, you can come up with statistics to prove anything, Kent. Forty percent of all people know that.
Example of RSE • RSE is the fact that - each time you draw a sample from a population, the values of those statistics (Mean, SD, etc…) will be different to some degree • Suppose we want to determine the average points per game of an NBA player from 2008-2009 (population parameter) • If I sample around 30 players 3 times, and calculate their average points per game I’ll end up with 3 different numbers (sample statistics) • Which 1 of the 3 sample statistics is correct?
8 random samples of 10% of population: Note the varying Mean and SD – this is RSE!
Knowing this… • The process of statistics provides us with a guide to help us minimize the risk of making Type I/Type II errors and RSE • Statistical significance • Recall, random sampling error is less likely when: • You draw a larger sample size from the population (larger n) • The variable you are measuring has less variance (smaller standard deviation) • Hence, we calculate statistical significance with a formula that incorporates the sample size, the mean, and the SD of the sample
Statistical Significance • All statistical tests (t-tests, correlation, regression, etc…) provide an estimate of statistical significance • When comparing two groups (experimental vs control) – how different do they need to before we can determine if the treatment worked? Perhaps any difference is due to the random chance of sampling (RSE)? • When looking for an association between 2 variables – how do we know if there really is an association or if what we’re seeing is due to the random chance of sampling? • Statistical significance puts a value on this chance
Statistical Significance • Statistical significance is defined with a p-value • pis a probability, ranging from near0 to near1 • Assuming the null hypothesis is true, p is the probability that these results could be due to RSE • If p is small, you can be more confident you are looking at the reality (truth) • If p is large, it’s more likely any differences between groups or associations between variables are due to random chance • Notice there are no absolutes here –never 100% sure
Statistical Significance • All analytic research estimates ‘statistical significance’ – but this is different from ‘importance’ • Dictionary definition of Significance: • The probability the observed effect was caused by something other than mere chance (mere chance = RSE) • This does NOT tell you anything about how important or meaningful the result is! • P-values are about RSE and statistical interpretation, not about how “significant” your findings are
Example • Tonight we’ll be working with NFL combine data • Suppose I want to see if WR’s are faster than OL’s • Compare 40-yard dash times • I’ll randomly select a few cases and run a statistical test (in this case, a t-test) • The test will provide me with the mean and standard deviation of 40 yard dash times – along with a p-value for that test
Results • HA: WR are faster than linemen • HO: WR are not faster than linemen • WR are faster than linemen, by about 0.8 seconds • With a p-value so low, there is a small chance this difference is due to RSE
HO: WR are not faster than linemen Results • WR are faster than linemen, by about 0.8 seconds • If the null hypothesis was true, and we drew more samples and repeated this comparison 1,000 times, we would expect to see a difference of 0.8 seconds or larger only 20 times out of 1,000 (2% of the time) • Unlikely this is NOT a real difference (low prob of Type I error)
Example…AGAIN • Suppose I want to see if OG’s are faster than OT’s • Compare 40-yard dash times • I’ll randomly select a few cases and run a statistical test • The test will provide me with the mean and standard deviation of 40 yard dash times – along with a p-value for that test
Results • HA: OG are faster than OT • HO: OG are not faster than OT • OG are faster than OT, by about 0.1 seconds • With a p-value so high, there is a high chance this difference is due to RSE (OG aren’t really faster)
Results HO: OG are not faster than OT • OG are faster than OT, by about 0.1 seconds • If the null hypothesis was true, and we drew more samples and repeated this comparison 1,000 times, we would expect to see a difference of 0.1 seconds or larger 570 times out of 1,000 (57% of the time) • Unlikely this is a real difference (high prob of Type I error)
Alpha • However, this raises the question, “How small a p-value is small enough?” • To conclude there is a real difference or real association • To remain objective, researchers make this decision BEFORE each new statistical test (p is set a priori) • Referred to as alpha, α • The value of p that needs to be obtained before concluding that the difference is statistically significant • p< 0.10 • p< 0.05 • p< 0.01 • p< 0.001
p-values • WARNINGS: • A p-value of 0.03 is NOT interpreted as: • “This difference has a 97% chance of being real and a 3% chance of being due to RSE” • Rather • “If the null hypothesis is true, there is a 3% chance of observing a difference (or association) as large (or larger)” • p-values are calculated differently for each statistic (t-test, correlations, etc…) – just know a p-value incorporates the SD (variability) and n (sample size) • SPSS outputs a p-value for each test • Sometimes it’s “0.000” in SPSS – but that is NOT true • Instead report as “p < 0.001”
Correlation Association between 2 variables
The everyday notion of correlation • Connection • Relation • Linkage • Conjunction • Dependence • and the ever too ready “cause” NY Times, 10/24/ 2010 Stories vs. Statistics By JOHN ALLEN PAULOS
Correlations • Knowing p-values and statistical significance, now we can begin ‘analyzing’ data • Perhaps the most often used stat with a p-value is the correlation • Suppose we wished to graph the relationship between foot length and height of 20 subjects • In order to create the scatterplot, we need the foot length and height for each of our subjects.
Scatterplot • Assume our first subject had a 12 inch foot and was 70 inches tall. • Find 12 inches on the x-axis. • Find 70 inches on the y-axis. • Locate the intersection of 12 and 70. • Place a dot at the intersection of 12 and 70.
Scatterplot Height Foot Length
Scatterplot • Continue to plot each subject based on x and y • Eventually, if the two variables are related in some way, we will see a pattern…
A Pattern Emerges • The more closely they cluster to a line that is drawn through them, the stronger the linear relationship between the two variables is (in this case foot length and height). • Envelope Height Foot Length
Describing These Patterns • If the points have an upward movement from left to right, the relationship is “positive • As one increases, the other increases (larger feet > taller people + smaller feet > shorter people)
Describing These Patterns • If the points on the scatterplot have a downward movement from left to right, the relationship is negative. • As one increases, the other decreases (and visa versa)
Strength of Relationship • Not only do relationships have direction (positive and negative), they also have strength (from 0.00 to 1.00 and from 0.00 to –1.00). • Also known as “magnitude” of the relationship • The more closely the points cluster toward a straight line, the stronger the relationship is.
Pearson’s r • For this procedure, we use Pearson’s r • aka Pearson Product Moment Correlation Coefficient • What calculations go into this calculation? Recognize them? ( (Xi - X) * (Yi -Y) ) r = (Xi - X)2 * (Yi - Y)2
Pearson’s r • As mentioned, correlations like Pearson’s r accomplish two things: • Explain the direction of the relationship between 2 variables • Positive vs Negative • Explain the strength (magnitude) of the relationship between 2 variables • Range from -1 to 0 to +1 • The closer to 1 (positive or negative), the stronger it is
Strength of Relationship • A set of scores with r = –0.60 has the same strength as a set of scores with r = +0.60 because both sets cluster similarly.
Statistical Assumptions • From here forward, each new statistic we discuss will have it’s own set of ‘assumptions’ • Statistical assumptions serve as a checklist of items that should be true in order for the statistic to be valid • SPSS will do whatever you tell it to do – you have to personally verify assumptions before moving forward • Kind of like being female is an ‘assumption’ of taking a pregnancy test • If you aren’t female – you can take one – but it’s not really going to mean anything
Assumptions of Pearson’s r • 1) The measures are approximately normally distributed • Avoid using highly skewed data, or data with multiple modes, etc…, should approximate that bell curve shape • 2) The variance of the two measures is similar (homoscedasticity) -- check with scatterplot • See upcoming slide • 3) The sample represents the population • If your sample doesn’t represent your target population, then your correlation won’t mean anything • These three assumptions are pretty much critical to most of the statistics we’ll learn about (not unique to correlation)
Homoscedasticity • Homoscedasticity is the assumption that the variability in scores for one variable is roughly the same at all values of the other variable • Heteroscedasticity=dissimilar variability across values; ex. income vs. food consumption (income is highly variable and skewed, but food consumption is not
Note how variable the points are, especially towards one end of the plot